Activity charts
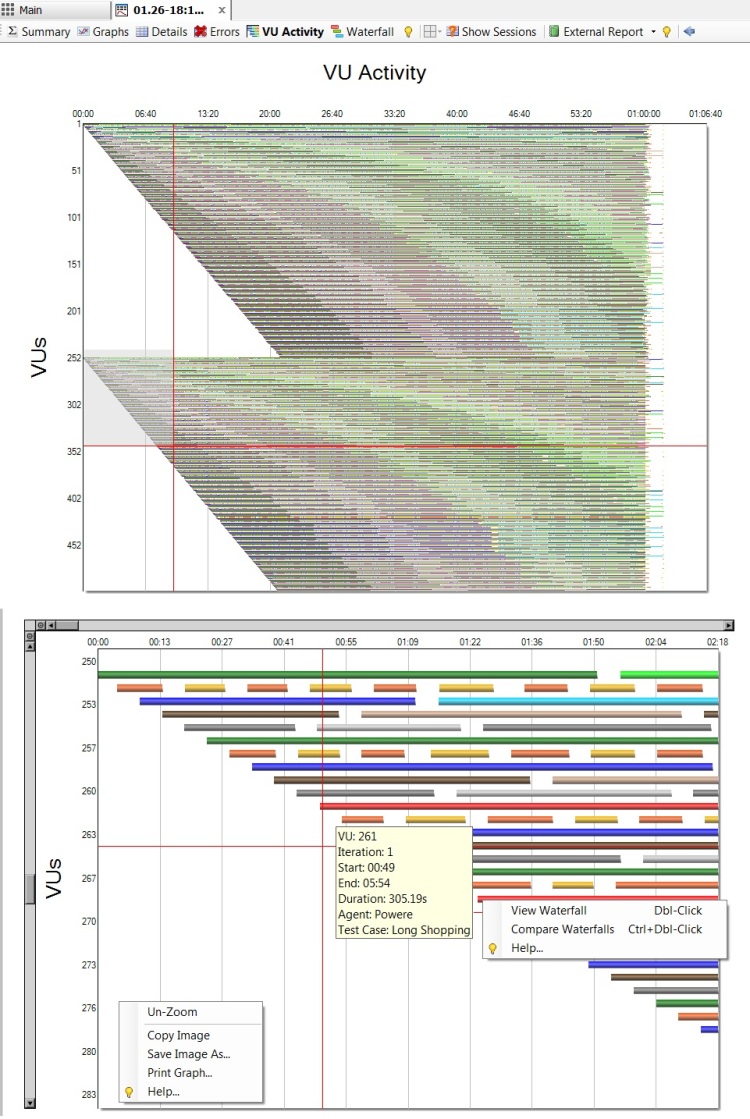
1. Test VU Activity Chart. The new view in the test report shows activity of every VU associated with the load test. It allows to visualize the VUs' actions and how they relate to other VUs' actions. VU Activity chart helps to isolate performance issues by seeing how load patterns and test case concurrences correlate with slower test iterations (see http://support.stresstimulus.com/display/doc42/VU+Activity+View).
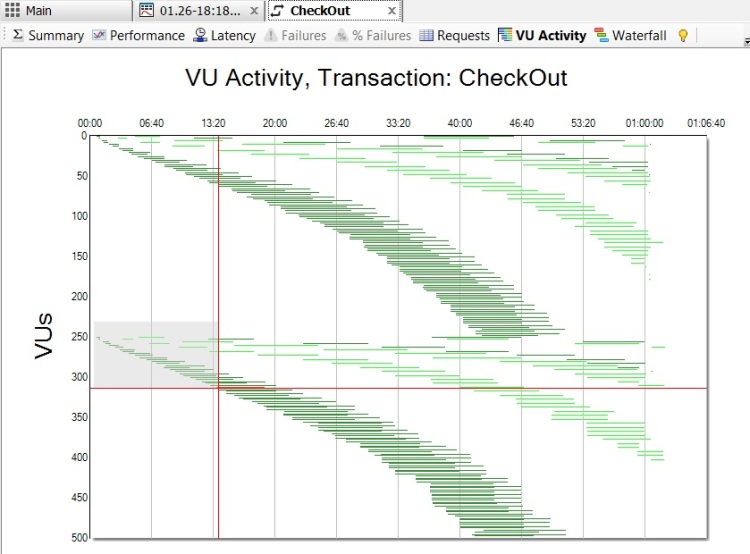
2. Transaction or page VU Activity Chart. The VU Activity Chart for a page or a transaction shows on the test timeline, which VUs requested the page or executed the transaction on a different test iteration. It helps isolate performance issues by seeing how load patterns and VU concurrences correlate with slow pages / transactions (see http://support.stresstimulus.com/display/doc42/VU-Activity+View).
3. Drilling down from VU Activity to Waterfalls. Now you can drill down every test iteration, page or transaction in activity view to display a corresponding waterfall chart showing activity detailed to the level of individual requests. Simply double-click a bar representing a test iteration, page or transaction.
4. Comparing two iterations / pages / transactions from Activity View. You can compare two waterfalls recalled from activity view. After selecting the first waterfall, navigate back to VU Activity view and Ctrl+Dbl-Click the second iteration / page / transaction bar. The dual waterfall view will display side-by-side comparison.
Waterfall Charts
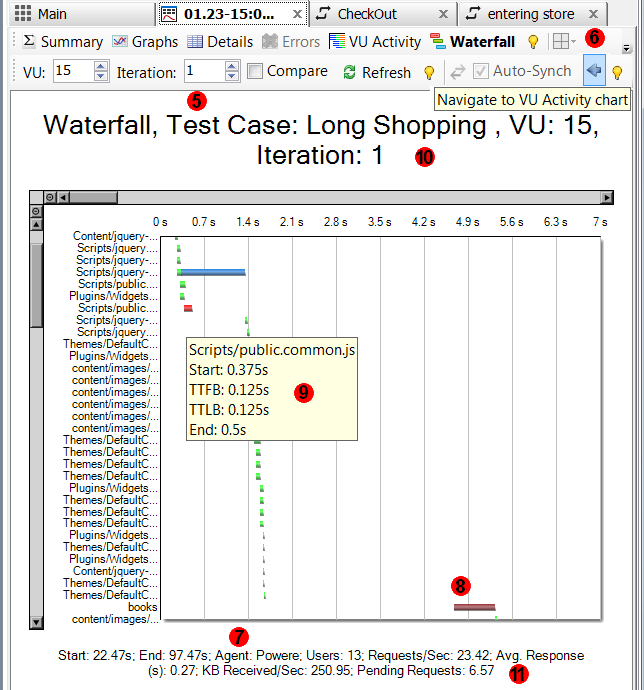
5. Waterfall chart for a test case. In the initial beta release, waterfall charts where available for pages and transactions. In this update, waterfalls are extended to the test case. See http://support.stresstimulus.com/display/doc42/Waterfall++View
6. Go back to activity from a Waterfall. In waterfall view, on the toolbar a button is added to navigate back to activity.
7. Waterfall for VUs, emulated on agents. In the previous version, in distributed tests with SQL Server CE-based storage, session information regarding VUs emulated on Agents was not available on the controller. Therefore waterfall charts were not available for these VUs. In the current update, the VUs session information from agents is replicated to the controller. As a result, a waterfall can be generated for all VUs.
8. Highlighting primary requests in waterfall charts. Primary requests are now colored differently from dependent requests. This is especially helpful for transaction waterfalls and test case waterfalls as it gives page breakdown visualization. It also helps to easily identify the location of the abnormal requests in the transactions and test cases. Also, request tooltip indicates which requests are primary.
9. Request tooltip show more information. Time to last byte (TTLB) parameter is added.
10. Waterfall chart title includes:
- Page, Transaction or Test case name
- The virtual user and iteration
(see http://support.stresstimulus.com/display/doc42/Inspecting+Sessions)
11. Expanded KPI snapshot on Waterfalls. Now it includes the following additional parameters: agent name and waterfall start/end timestamps on the test timeline. This will help to more accurately put the waterfall in the context of the load test (see http://support.stresstimulus.com/display/doc42/Single+Waterfall+Chart ).
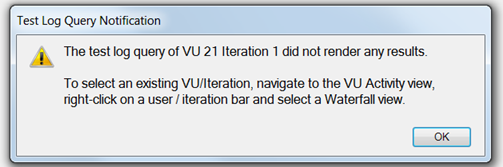
12. In waterfall view, if you select a non existing VU / iteration that does not correspond to a selected transaction or page, then a notification will suggest to select the VU / iteration from the VU Activity view.
To navigate to other parts of the v4.2 release notes, click the links below:
4.2 is available here