One of the most effective tools for evaluating the web performance-related user experience is a Waterfall chart. It depicts a timeline diagram of requesting and loading page resources. Waterfall charts are broadly used by performance engineers to granularly analyze factors impacting page responsiveness. Up till now however, waterfall charts were used to analyze user experience without tying it into the overall load considerations of a website.
In v4.2, for the 1st time in the industry, waterfall charts are extended beyond analyzing a single user's experience and instead are measured in conjunction with website load conditions, see http://support.stresstimulus.com/display/doc42/Waterfall+View. In that respect the following features are available:
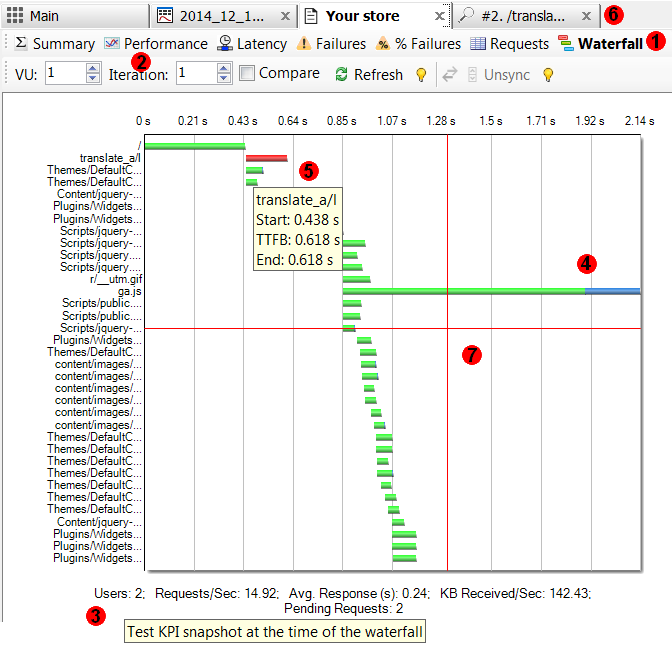
1. Waterfall for every page and transaction. Page and transaction reports now include a Waterfall button that opens waterfall view, as described here http://support.stresstimulus.com/display/doc42/Single+Waterfall+Chart
2. Waterfall for every VU and iteration. Select any VU and iteration for which you need to generate a waterfall.
3. Waterfall in the context of the load test. A key performance indicator snapshot taken during the time of the waterfall is displayed on the bottom of the chart.
4. Server and network time for each request. Request bars depict with a green horizontal area representing server time and a blue area representing network time.
5. Request detail information. To display request details, mouse over its bar. A tool-tip displays the request name and its timing information.
6. Request content. To access the content of a request, double-click it and a session inspector will open in a new tab.
7. Easily compare request/response events positioning on the timeline. Click the appropriate point in the graph panel and a vertical and horizontal red line crossing this point will appear.
8. Display two waterfalls side-by-side. Check the Compare box on the toolbar, select the 2nd VU and Iteration and the second waterfall will appear on the right. KPI snapshots on the bottom of each waterfall help to compare them in the context of the overall site load.
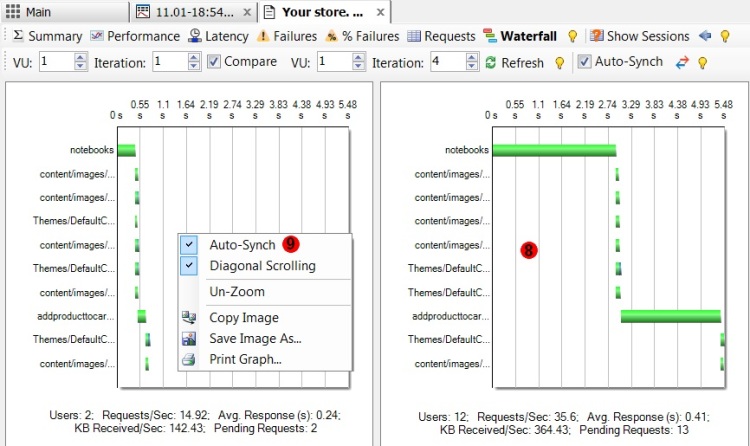
9. Auto-Synch scrolling and zooming of the two waterfalls so they are always aligned.
10. Waterfall zoom/un-zoom. To zoom-in on a graph, select a rectangular area. For additional zooming, select a rectangular area again. You can undo to last zoom, or remove zoom altogether, as described here http://support.stresstimulus.com/display/doc42/Waterfall+Chart+Commands
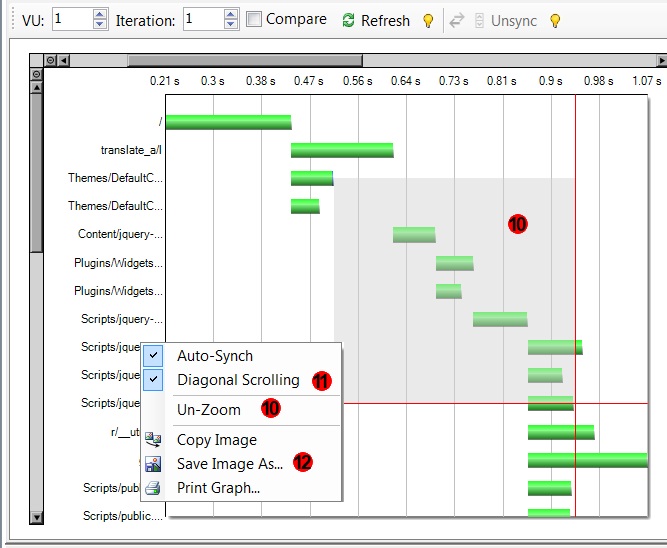
11. Diagonal Scrolling. When you scroll vertically, the right amount of horizontal scrolling is added automatically so the request bars are always the visible area of the chart.
12. Multiple graph commands. You can copy a waterfall Image into the clipboard and save it as an image file or print.
To navigate to other parts of the v4.2 release notes, click the links below:
4.2 is available here