Update:The final version of V1.5 with 40+ features is released on 3/1/12.
Three enhancements are added to the progress bar:
1. Health monitor.The Health monitor positioned on the progress bar alerts when the test machine is approaching its capacity limit. This helps to avoid test machine overload, in order to sustain high test accuracy.
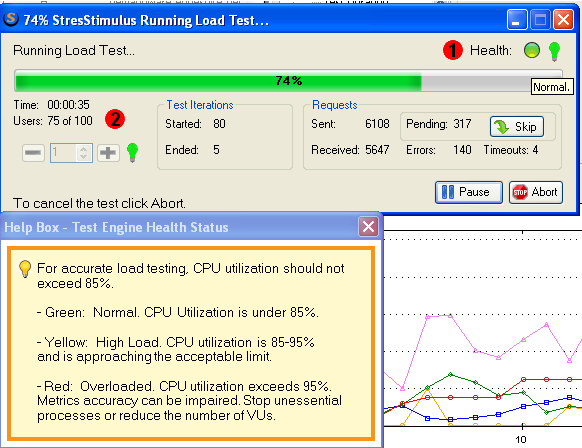
The following color coding is used:
• Green: Normal. CPU Utilization is under 85%.
• Yellow: High Load. CPU utilization is 85-95%. Metrics accuracy can be impaired.
• Red: Overloaded. CPU utilization exceeds 95%. Metrics accuracy will be likely impaired. Stop unessential processes or reduce the number of VUs.
2. Enhanced user counter:when the Test Duration is set to the "Reaching Max Users", the Users counter shows the current and the maximum number of users.
3. Skip pending requests.The Skip button allows the load engine to abandon all pending requests instead of waiting for the arrival of the corresponding server responses. Abandoned requests are counted as timed out.
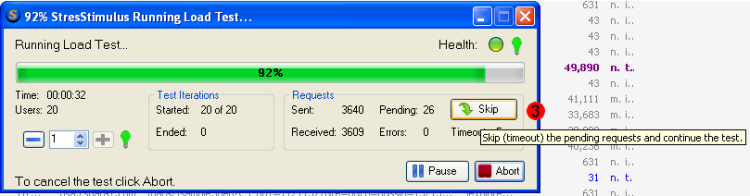
Skipping pending requests allows the load engine to faster proceed with issuing remaining queued requests. This feature is helpful when the user wants to complete the test that that seems to be "frozen" because some of the (pending) requests causing slow server response.
In the Test Configuration section the following two enhancements are implemented:
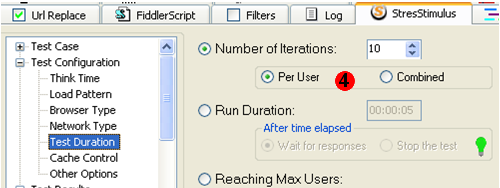
4. Iterations per VU.The "test duration" screen added an option to set the number of iterations per VU. Before, only the Combined option was available.
5. Configurable number of threads allocated for the Load Engine.User can configure the starting number of threads, which created automatically. The default number is 2. If more threads are needed, load engine first will check if system resources are available.
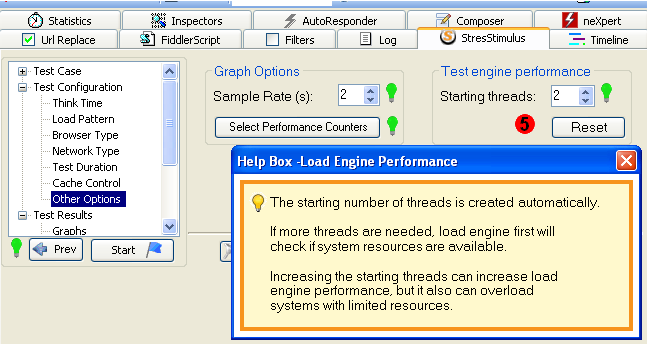
Increasing the number of starting threads can increase the load engine performance on a high capacity systems, because more threads are created faster without overheads of checking if more system resources are available. But systems with limited resources can be overloaded, if the number of starting threads is too high.
In order to maximize the load engine performance on your system, find the optimal number of starting threads. Run several tests with different number of starting threads, while keeping all other parameters unchanged. Also, make sure that the Health Monitor is in the "green" zone. The Load engine has better performance in the test with a higher rate of sending requests.
Among other enhancement are the following:
6. Multi-threading Load Engine overhaul.v1.5 has the fiercest StresStimulus load engine to date. It can issue more requests per second and can handle more VUs before CPU capacity exceed acceptable limit.
7. New support tool - Upload Support Case.The new support tool allows you to upload the current test to Stimulus Technology's secure repository for StresStimulus's support review. To upload a support case, click "Support Options" in the StresStimulus menu and then select "Upload Support Case". In the appeared message box, check what elements of the test you wish to upload: the test report, the Test Case sessions with the test configuration, and the test result sessions.
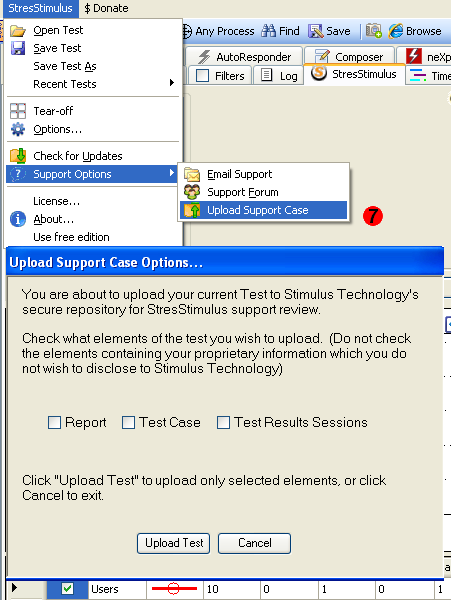
After clicking "Upload Test" the appropriate elements will be stored on your hard drive and then automatically uploaded to the Stimulus Technology's secure repository using SSL encryption. Your StresStimulus's serial number identifying your contact information will be uploaded as well. StresStimulus support personnel will be in touch with you to follow-up with your test case.
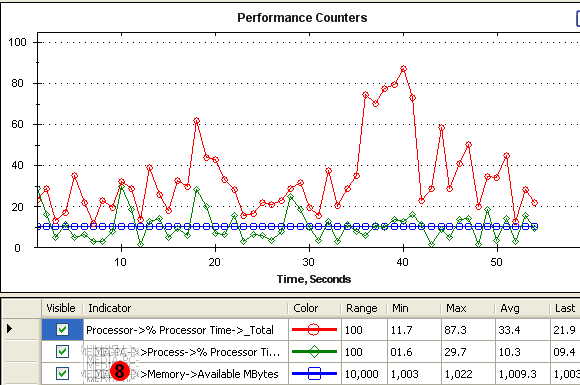
8. Available Memory graph.Available memory counter is added to the Performance Counters graph.
9. Comparing replayed session with the corresponding recorded session. One of the effective techniques of troubleshooting a test is to compare replayed requests with the corresponding recorded requests. This version of StresStimulus made it easier.
First, select which replayed sessions you wish to display in the Fiddler grid using one of the display options of the "Show…." button. After that, select the necessary replayed sessions, right-click, and under the "StresStimulus Commands" select "Show Matching Test Case Session(s)".
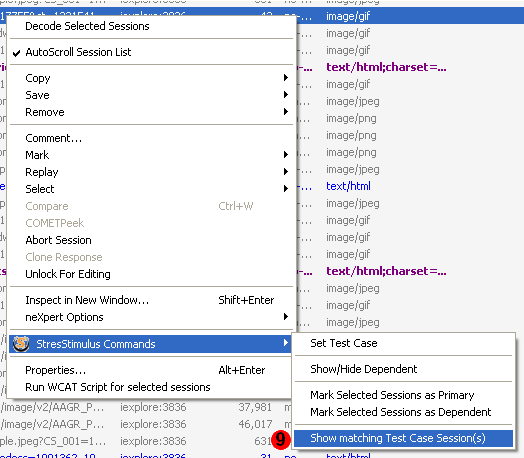
The matching test case sessions will appear in the Fiddler grid. To further compare replayed and recorded sessions' response/request (whether you need to compare bodies or headers), select a pair of sessions and hit <Ctrl>-W . The launched WInDiff tool will display the necessary information.
10. StresStimulus's Test Quick start.Before 1.5 in order to start a Test you needed to manually launch Fiddler, select StresStimulus tab and then manually open the test. Now you can just simply double-click on the test's ssconfig file, and Fiddler / StresStimulus will automatically start and load the test.
To navigable to other parts of the v1.5 release notes, click the links below:
v1.5 beta is available for download here.