The next report that we will verify is the Request Details grid (Fig. 1). It aggregates test requests across all pages by their URL without the query string. If the same resource (image, style sheet, etc.) is referenced in several different pages, then all of their request will be combined into one row on this grid. Therefore the number of rows in the grid can be fewer that the number of URLs in the test case. The Request Details grid does not distinguish between primary and dependent requests.
Tip A: As in Part 3, to display all test requests in the Fiddler grid, click on the drop arrow on the split button and click "Show Test Results - All Requests". Then select all sessions and select the “Statistics” tab in Fiddler.
Tip B: As in Part 2, for easier calculation, click the upper left corner of the Request Details grid to select all records, copy them and paste into Excel to calculate totals.
1. Total Number of requests.
The "Number of Requests" column displays the number of requests issued to each URL. The sum of this column is the total number of requests issued during the test (Fig. 1A). It should be equal to:
- The "Request Count" on the Fiddler Statistics tab and the Fiddler status line (Fig. 1B);
- The "Total Requests" in the Test Summary Report (Fig. 1C);
- The Sum of the "Total Request" column in the "Iteration Details" grid (Fig. 1D).
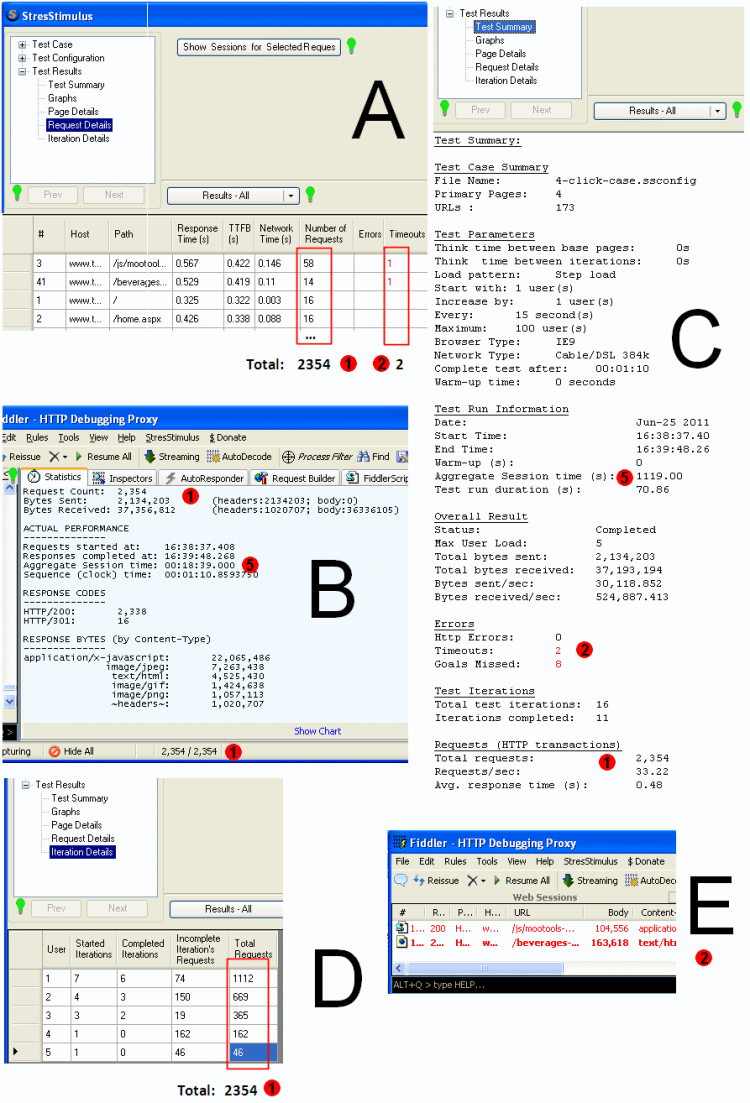
Fig. 1
2. Timeouts, Errors.
The Timeouts column (Fig. 1A) displays the number of registered timeouts for each URL during the test. A timeout event is registered when the response time of a request exceeds the page timeout value, which can be checked or changed on the Page Detailed grid. The sum of this column should be equal to the "Timeouts" in the Test Summary Report (Fig. 1C).
Similarly, the Errors column displays the number of HTTP errors for each URL during the test. Every response with the status code in the 400 or 500 range is counted as an error. The sum of this column should be equal to the "HTTP Errors” in the Test Summary Report.
To display all requests with timeouts and errors in Fiddler, click "Show Test Results - Errors and Timeouts". The total number of displayed session in the Fiddler should be equal to the combined number of the Timeouts and Errors in the Request Details grid (Fig. 1E). Sort the Fiddler grid by URL to match up the errors and timeouts for a specific URL with the corresponding value in the Request Details grid.
3. Number of requests.
To verify the number of requests for any selected in the Request Details grid URL, click "Show Sessions for Selected Requests" button. The fiddler grid will display all requests to the selected URLs. The “Number of Requests” value (Fig. 2A) should be equal to the number of sessions in the Fiddler grid, displayed on the status line (Fig. 2B).
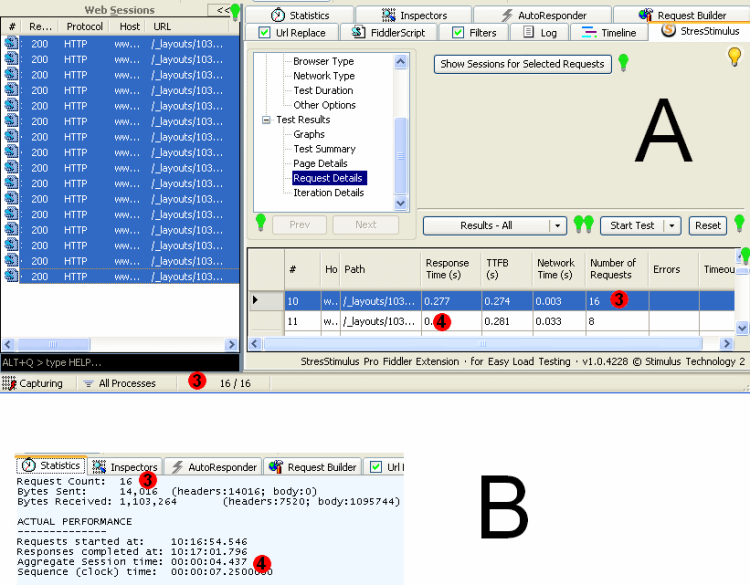
Fig. 2
4. TTFB, Network Time, Response Time.
The TTFB (time to the first byte) is the average time to receive the first byte of a response. The Network Time is the average time between receiving the first and the last byte of a response necessary for transferring it over the network. The Response Time is the average time to receive the response that is also called TTLB (time to the last byte).
For every URL the following two formulas are applied:
[TTFB] + [Network Time] = [Response Time] , (see Fig. 2A).
[Response Time] x [Number of Requests] = [Aggregate Session Time] , (on the Fiddler Statistics tab, Fig. 2B).
In the provided example:
[Response Time] x [Number of Requests] = 0.277s x 16 = 4.43s
[Aggregate Session Time] = 4.437s
5..Total Response Time.
Apply calculation in the last formula to all the URLs in the Request Details grid, and find the sum, using Excel (Fig. 3.) This number should match:
- The Aggregate Session time in the Fiddler Statistics tab (Fig. 1.B);
- The Aggregate Session time in the StresStimulus's Summary Report (Fig. 1.C).
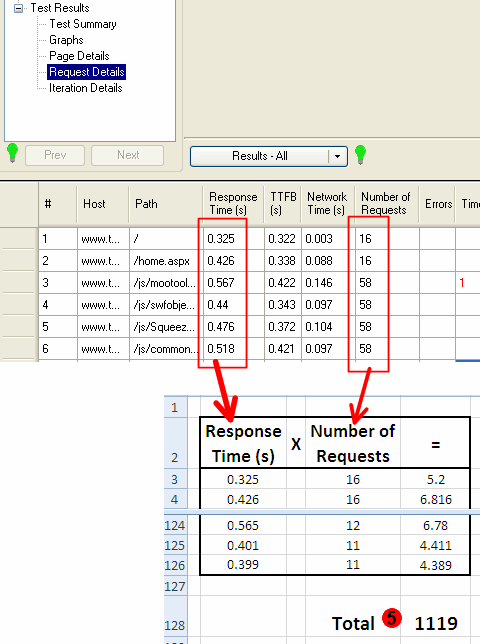
Fig. 3
The described Validation method allows verifying virtually every number on the request details grid. Use it when you have questions about StresStimulus Request Details grid numbers. Calculated values are subject to rounding discrepancy that typically does not exceed 0.5-1%.
To navigable to other chapters, click the links below:
<-- Read the previous part