The first report that we will verify after completing the test is the Summary Report (Fig. 1 A). This is the most informative report, since it gives a bird eye view on your load test.
To display all test sessions (HTTP transactions) in the Fiddler grid, click on the drop arrow on the split button and click "Show Test Results - All Requests". Then select all sessions and select the “Statistics” tab in Fiddler (Fig. 1 B).
In the “Test Case Summary" section the "Primary Pages" and "URLs" display the numbers from the "Test Case" section (see Part 2: Page Settings, Fig.1, item 1) in the navigation tree.
“Test Parameters" section displays settings from the "Test Configuration" section in the navigation tree set by the user.
"Test Run Information" section displays the following test run timing information:
- 1. "Start Time" and "End Time" should match the timestamps "Requests started at" and "Requests completed at" in Fiddler.
- "Warm-up (s)" is the warm-up time actually used in the test. It should be close to the value in the Test Parameters section.
- 2. "Aggregate Session time" is the sum of all session durations on the time line. The session duration is the time between when a request is sent and the corresponding response is received. Because sessions are occurring in parallel, the Aggregate Session time substantially exceeds the clock time. StresStimulus' and Fiddler's Aggregate Session time should match.
- 3. "Test run duration (s)" is calculated as [End Time] - [Start Time]. It should be equal to the Fiddler's "Sequence (clock) time".
9/10/12 update: a new parameter is added: Avg. Page/sec is received by dividing Total Pages requests from the Pages subsection by Test run duration (s) fro the Test Run Information subsection.
Overall Result section:
- “Status” shows whether the test was Completed, Aborted etc.
- “Max User Load” is the maximum number of VUs, reached during the test. When the Constant Load pattern is selected, it will be equal to the set number of VUs. When the Step Load pattern is selected, it will be equal to the Max number of VUs or a smaller number that the test duration limit permits to reach.
- 4. “Total bytes sent” and “Total bytes received”:
- "Total bytes sent" is the total amount of test upload traffic that is equal to the sum of all requests' sizes. It should be the same as the "Byte Sent" in Fiddler.
- "Total bytes received" is the total amount of test download traffic that is equal to the sum of all responses' sizes. It should be the same as the "Byte Received" in Fiddler.
Tip: By default, StresStimulus registers the responses' sizes, and purges response bodies to save client resources on sizable, intensive and long tests. As a result the "Byte Received" value in Fiddler will be substantially smaller than the one in StresStimulus. To keep the response bodies, select "None" in the "Purge response bodies" drop-down located in the StresStimulus main menu ->Options.
- 5. “Bytes sent/sec” and “Bytes received/sec”:
- "Bytes sent/sec" is calculated as [Total bytes sent] / [Test run duration].
- "Bytes received/sec" is calculated as [Total bytes received] / [Test run duration].
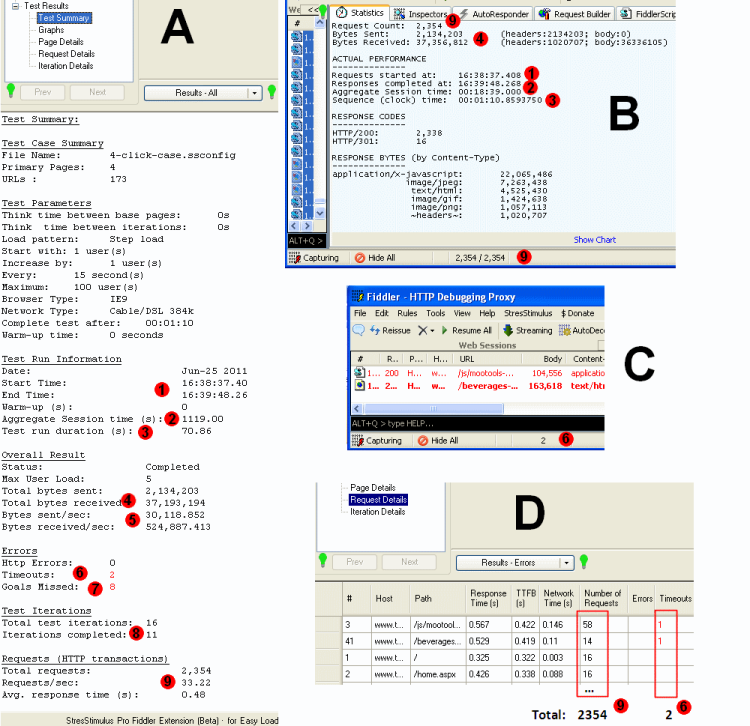
Fig.1
Errors Section:
- 6. “Http Errors” and “Timeouts”:
- "HTTP Errors" is the number of responses with status codes in the 400s or 500s range. To display HTTP Errors in Fiddler, click on the drop arrow on the split button and click "Show Test Results - Errors and Timeouts". HTTP Errors should be equal to the number of sessions in the Fiddler grid with "Result" in the 400s or 500s range. It also should be equal to the total of the "Errors" column in Request Details grid.
- "Timeouts" is the number of sessions with response time exceeding the "Timeout" value set in the Page Settings section for the respective page. Timeouts should be equal to the number of sessions in the Fiddler grid with "Result" not in the 400s or 500s range (Fig 1 C). Additionally, it should be equal to the total of the "Timeout" column in the Request Details grid (Fig 1 D). It also should be equal to the total of the "Request Timeout" column in the Page Details grid (Fig 2).
- 7. "Missed Goals" is the number of all page iterations with the response time exceeding the respective page goal, set in the Page Settings section. To verify this number against the Page Details data, multiply "Iterations" by "% Missed Goal" to receive the page iterations with missed goals. The sum of the latter should equal to the “Missed Goals” (Fig 2).
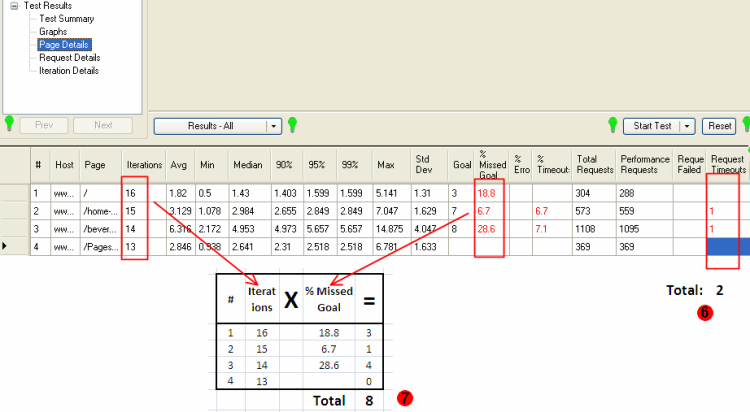
Fig.2
Test Iterations section:
- 8. “Total test iterations” and “Iterations completed”:
- Test iteration is a test case replayed once by a single VU.
- "Total test iterations" is a combined number of test iterations started by all VUs. It should be equal to the sum of the "Started Iterations" column in the VU Iteration Details grid (Fig 3).
- "Iterations completed" is a combined number of test iterations completed by all VUs. It should be equal to the sum of "Completed Iterations" column in VU Iteration Details grid.
Tip: When in the Test Configuration section the Test Completion criteria is set to “Run Duration”, or “Reaching Max Users”, the load test will end before some of the iterations will fully complete. Incomplete iterations on the test does not suggest that anything went wrong during the test.
Requests (HTTP transactions) section:
- 9. "Total Requests" is a combined number of requests issued during the test. It should be equal to the "Request Count" on the Fiddler grid and the Fiddler status line (Fig 1B). It also should be equal to sum of the "Number of Requests" column on the "Request Details" grid.
- "Requests/sec” is the number of HTTP transactions (sessions) issued by the load test engine. It is calculated as [Total Requests] / [Test run duration].
- "Avg. response time (s)" is calculated as [Aggregate Session time] / [Total Requests].
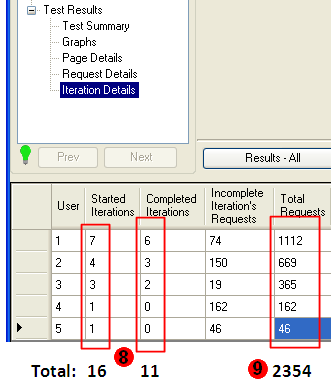
Fig.3
Use this process every time when you have questions about StresStimulus Summary report numbers. Calculated values are subject to rounding discrepancy that typically does not exceed 0.5-1%
To navigable to other chapters, click the links below:
<-- Read the previous part Read the next part -->