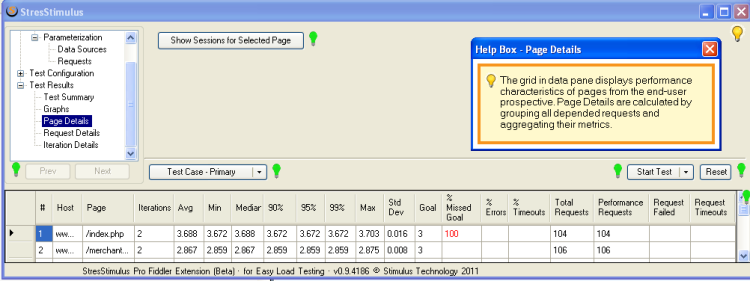
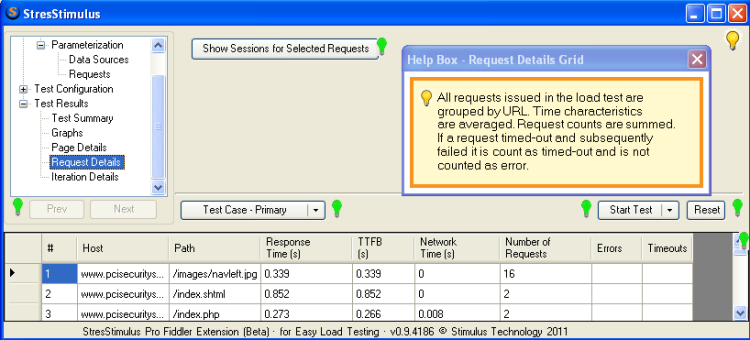
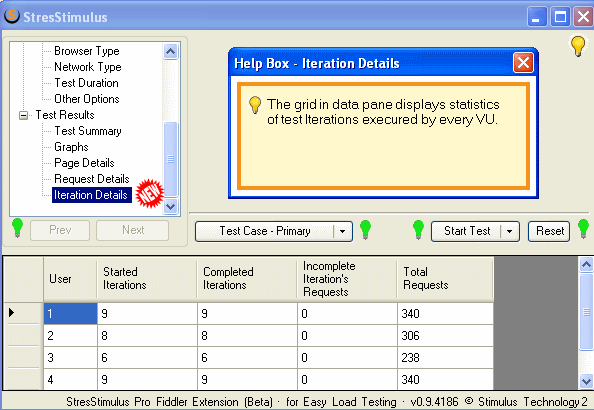
In the Test Results section, the amount of information reported in the detail's grids was substantially increased. More than 20 new parameters were added. Below is the complete description of all of the grids' columns. New columns in this release are shown in blue.
1. Page Details grid.Added support for page response time goal and several page response time statistics.

Header
|
Description
|
#
|
The page number
|
Host
|
The page host
|
Page
|
The page path
|
Iterations
|
The number of times the Page was requested in a load test
|
Avg
|
The average page response time
|
Min
|
The minimum page response time
|
Median
|
The median page response time
|
90%
|
The maximum page response time after excluding the slowest 10% of page iterations
|
95%
|
The maximum page response time after excluding the slowest 5% of page iterations
|
99%
|
The maximum page response time after excluding the slowest 1% of page iterations
|
Max
|
The maximum page response time
|
Std Dev
|
The page response time standard deviation
|
Goal
|
The page response time goal
|
%Missed Goal
|
% of page iterations with the response time exceeding the Goal
|
%Errors
|
% of page iterations with at least one HTTP error
|
%Timeouts
|
% of page iterations when the timeout was registered for at least one request
|
Total Requests
|
The number of requests issued during all page's iterations
|
Performance Impacting Requests
|
The number of requests excluding requests loaded after the page is displays, e.g. AJAX
|
Request Failed
|
The number of HTTP errors on all page's iterations
|
Request Timeouts
|
The number of request timeouts registered on all page's iterations
|
2. Request Details grid.Added several request's performance parameters.

Header
|
Description
|
#
|
Request number
|
Host
|
The request host
|
Path
|
The request path
|
Response Time (s)
|
The average time to receive the response (TTLB)
|
TTFB(s)
|
The average time to receive the first byte of a response
|
Network Time (s)
|
The average time between receiving the first and the last byte of a response necessary for transferring it over the network
|
Number of Requests
|
The number of times the request was issued during the load test
|
Errors
|
The number of the request's failures during the load test
|
Timeouts
|
The number of the request's timeouts registered during the load test
|
3. VU Iteration Details grid.This section is new. It displays statistics of test iterations executed by every VU.

Header
|
Description
|
User
|
The Virtual User (VU) number
|
Started Iterations
|
The number of started Test Iterations
|
Completed Iterations
|
The number of Iterations, where all test case's URLs were requested
|
Incomplete Iteration's Requests
|
The number of requests in the last Incomplete Iteration
|
Total Requests
|
The total number of requests in all Test Iterations
|
4. Added an Error section on the Test Summary report.Added a new Errors section on the summary report to show HTTP errors, timeouts, and goal missed - displayed in red.
Test Summary
………..
Errors
HTTP errors: 6
Timeouts: 5
Goal missed: 1
5. Performance counters enhancements.Increased the number of performance counters to 10. Enabled graphing performance counters of a network computer, such as a web server.
Read other blogs about this release: