|
Unregistered User Posts: 514
5/18/2011
|
Hi!
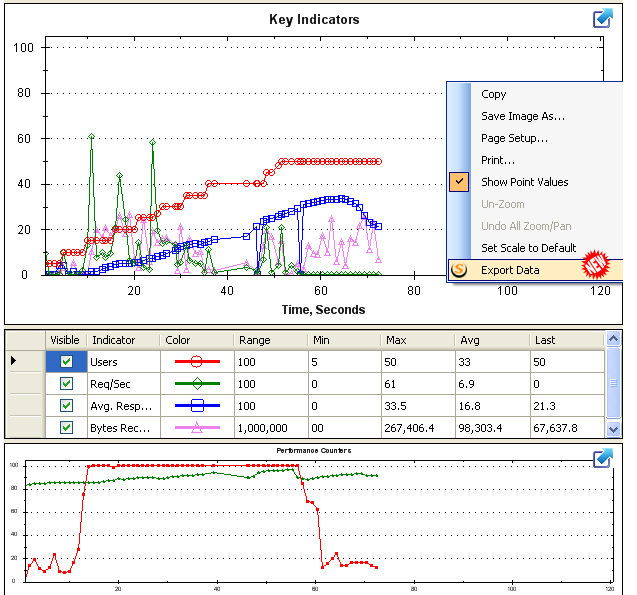
1. I would like to know if it is possible to export the result tables attached to the graphs of the performance counters result.
2. About databinding and sources, I cannot see the options for databinding. Is there any special mode that enables databinding?
3. Another problem I have is that i cannot upload the csv file to parametrize the requests with different data for each virtual user. Example: I want to test the registration of the site so i created a .csv with ten users to start a load testing and try Stresstimulus. But when i try to open the file, i have an error message saying that it is expecting 19 fields and it is receiving only one. Is it the comma the separator by default?
I am using it.
4. Is it possible to export from Stresstimulus to a .csv file the tables with the data in the requests? I think this way you reduce the possibility of an error when the user is designing the file, because he/she has the default exported format.
Thanks a lot for your attention.
Regards,
Patricia
|
|
|
0
link
|
|
Vadim @StresStimulus Administrator Posts: 583
5/18/2011
|
Hi Patricia,
Below are the answers to your questions:
1. Export graph results into table format is not currently available. I added this feature to the StresStimulus feature wish list.
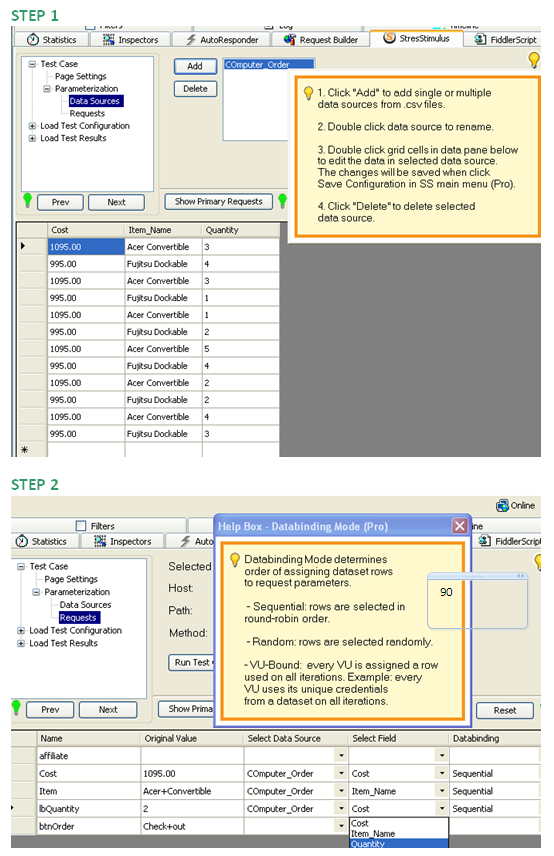
2. There are two steps to databind request parameters to dataset fields, shown on the screenshots below:
- Step 1 - Add datasets;
- Step 2 - Databind dataset fields with request parameters.
 3. The .csv file you are using may be formatted incorrectly. Every row should have the same number of fields; fields are comma separated; rows are separated by a new line character. You can create well formatted csv file in Excel: enter data to a worksheet and save it as csv File. 3. The .csv file you are using may be formatted incorrectly. Every row should have the same number of fields; fields are comma separated; rows are separated by a new line character. You can create well formatted csv file in Excel: enter data to a worksheet and save it as csv File.
In your case, if every user requires user name and password, then the csv file should have 11 rows (a header + 10 users) and 2 fields. When you open it in notepad make sure that it has 11 rows.
4. It's a good thought to simplify creation of .csv file template. I am not sure though how to make it easy to use. A request can have multiple parameters, and a user may need to parameterize only some of them. Sometimes it makes sense to use several .csv files to parameterize one request or to use one .csv file to parameterize multiple requests. So UI design does not seem straightforward.
Cheers,
-Vadim
|
|
|
0
link
|
|
Patricia Coronel Posts: 32
5/18/2011
|
Hi Vadim,
Thanks for your quick response! 
I have a new question. Which is the difference, in databinding, among the options Sequential, Random and VU_Bound?
Thanks again!
Patricia
|
|
|
0
link
|
|
Vadim @StresStimulus Administrator Posts: 583
5/19/2011
|
Patricia,
Databinding methods are described in this blog, from which I pasted the paragraph below:
Three mechanisms of traversing datasets for parameterization are available:
- Sequential (default) - dataset rows are selected in round-robin order as they got consumed by VUs.
- Random - dataset rows are selected randomly.
- VU-Bound - every user is assigned a row, which is used on all iterations. For example, if dataset contains unique credentials, then every VU will use the same credentials throughout the test.
Additionally, the random is described in this post:
Values selected randomly from the dataset’s designated field. For example, if dataset has values apple, banana, pear and, orange, then on first three iterations VU1 can request banana, apple and orange and VU2 can request apple, orange, apple. This can work to simulate scenarios when multiple VU independently populate web forms (i.e. order entry form) with a set of values (i.e. product inventory).
P.S. I have good news for you about your previous questions about exporting graph results into the table format. We will included this feature in the scheduled release for tomorrow, so stay tuned.
Cheers,
-Vadim
Patricia
|
|
|
0
link
|
|
Patricia Coronel Posts: 32
5/19/2011
|
Good! I am doing my first steps in performance testing and I believe this is a very good tool! I like a lot.
If you need help with documentation, or testing, please let me know. It will be a pleasure to assist you.
Regards,
Patricia
Vadim Kleyzit said:
Patricia,
Databinding methods are described in this blog, from which I pasted the paragraph below:
Three mechanisms of traversing datasets for parameterization are available:
- Sequential (default) - dataset rows are selected in round-robin order as they got consumed by VUs.
- Random - dataset rows are selected randomly.
- VU-Bound - every user is assigned a row, which is used on all iterations. For example, if dataset contains unique credentials, then every VU will use the same credentials throughout the test.
Additionally, the random is described in this post:
Values selected randomly from the dataset’s designated field. For example, if dataset has values apple, banana, pear and, orange, then on first three iterations VU1 can request banana, apple and orange and VU2 can request apple, orange, apple. This can work to simulate scenarios when multiple VU independently populate web forms (i.e. order entry form) with a set of values (i.e. product inventory).
P.S. I have good news for you about your previous questions about exporting graph results into the table format. We will included this feature in the scheduled release for tomorrow, so stay tuned.
Cheers,
-Vadim
Patricia
|
|
|
0
link
|
|
Vadim @StresStimulus Administrator Posts: 583
5/19/2011
|
Thank for the offer to help!
We developed StresStimulus specifically for people like yourself who are looking for an easy to use tool.
-Vadim
|
|
|
0
link
|
|
Vadim @StresStimulus Administrator Posts: 583
5/19/2011
|
Patricia,
The option to export graph results into .csv format was added in today's release. The screen-shot is pasted here.
-Cheers,
Vadim
|
|
|
0
link
|
|
Patricia Coronel Posts: 32
5/19/2011
|
Niceeeeee!!!!! Congrats! It will be very useful
I cannot se the screenshot. 
Thanks a lot for so good work!
Regards,
Patricia
Vadim Kleyzit said:
Patricia,
The option to export graph results into .csv format was added in today's release. The screen-shot is pasted here.
-Cheers,
Vadim
|
|
|
0
link
|
|
Vadim @StresStimulus Administrator Posts: 583
5/19/2011
|
My pleasure.
Here we go. Just right-click on the image..
|
|
|
0
link
|