|
Brianna Blanchard Posts: 76
6/3/2013
|
Hello,
Two questions here that are related:
1) On some of my SS tests, many of the average response time data points are zero. Does this mean that the response time was less than 1 ms, or that no responses were received? I am doubtful that no response is being received, because the average requests/sec never zero and is usually over 40, and there are no errors.
2) I see different average response times for the same data set. Under the Key Indicators table, for example, I got 0.016 secs. However, many of the data points for that test were zero, and it appears that this average does not include any of the zeros. On the other hand, if I look at the agent test results, then the average is very small, like .001s or 0s (two different runs of the same test). Finally, if I look at the datapoints for the key indicator graph and average the response times myself, including the zero results, I get an average of 0.0023, which is larger than the agent test results. What number is actually a good representation of the average?
|
|
|
0
link
|
|
Vadim @StresStimulus Administrator Posts: 583
6/3/2013
|
Hello Brianna,
On your first question: The reported response time resolution is 1 ms. Zeros identify responses times shorter than 500 microseconds.
In your second question, you are asking about various numbers in your tests. It would be difficult to offer you specific answers without having the entire test with indication on what numbers you are questioning and why. However, I can share some general thoughts on this topic.
- StresStimulus stores every session in its SQL Server storage and uses fiddler timers, (described here http://fiddler.wikidot.com/timers), to calculate all key performance indicators. So you can drill down virtually every calculation to verify it against the raw numbers while this is not particularly trivial exercise.
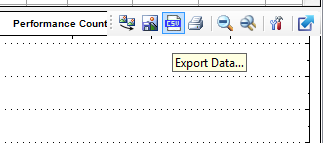
- All data points on the response time graph are used when calculating the average. "Zeros" are not quite zeros, but rather small numbers rounded to zero. To double check the calculation of the data points average, you can export data point information to a .csv file, as shown below, and verify the calculations.
- Data points are meant to show "instant" data, and, therefore, they include data only for completed sessions, with responses received before a checkpoint. In contrast, the summary report displays an aggregate of all sessions. The latter does not always match the former. Here's the example. A test runs for 60 seconds with Graph Sample Rate set to 5 seconds. There will be 13 data points (60/5 +1). Let's say the web application has one slow request with the response time equal to 59 seconds. This request will not be included into the 12 out of 13 data points, but it will be included in the summary report. In this case, the average of the 13 data points will be different from the average response time on the summary report.
- Unlike the agents, which report metrics collected from one test machine, the controller aggregates the metrics from all agents plus the controller.
- For an after-the-test performance analysis, the Summary report and details grids should be used in most cases. On the other hand, the graphs, which display real-time performance metrics, provide instant feedback during the test run.
If you have questions about specific StresStimulus metrics, I suggest the following.
- Point-out the number that you are questioning. Explain why do you think this number is incorrect, and what value or range you expect to see instead. Provide your complete calculation or rationale.
- Upload this test to our secure support repository from the StresStimulus main menu -> support options -> upload support case.
- We will compare your thoughts with the number in your tests and will explain the relevant StresStimulus calculation rules.
Does this make sense?
|
|
|
0
link
|
|
Brianna Blanchard Posts: 76
6/6/2013
|
Thank you for the clarifications. I have a few more questions after running a similar test to the initial test I posted about.
I was concerned that the agent results were different than from the Key Indicators table, which were different again from the averages I found myself by exporting the data points, especially because I'm only using one agent. I understand now why the Key Indicators may not be accurate, but I'm not sure what number I should use instead. You mentioned the summary reports, but since the summary reports rounds to a very small number of significant digits, I almost always just get 0 for the average response time.
An example set of average response times:
KeyIndicator Table: 0.0034
Agent: 0.0017
My Average of all points found in exported csv file (including zeros): 0.0025
my average from non-zero points: 0.0072
my average from all points where req/sec was non-zero: .0068
I was also concerned because when I ran this test (not the test I originally ran, I forgot to note which one that was), many of the data points for requests/sec were zero, implying that no requests were being made, which means that there are zeros from very fast requests being averages and also zeros from down time in between requests. The average I found for the requests/sec including all the times it was zero was 39.4, which is basically the same as the average found in the Summary and Agent results (39.6 and 39.5, respectively). This implies that all points were included in the average, even when no requests were being made, artificially lowering the average response time.
I have uploaded my test case to the support repository.
|
|
|
0
link
|
|
Vadim @StresStimulus Administrator Posts: 583
6/7/2013
|
Hello Brianna,
I was unable to analyze the raw numbers in your uploaded test because instead of the default embedded SQL CE you apparently use an external SQL Server as your data storage device. The latter obviously cannot be uploaded. However, I was able to answer even without looking into the test log, because you explained very clearly.
There are 3 topics at hand: resolution, accuracy and "excluding sessions with zero-request/second".
Resolution: StresStimulus displays up to 3-decimal points for all time-related data, providing up to 1 ms resolution. We thought that this will be sufficient for most applications. Apparently, in your case you need a higher resolution. Internally, StresStimulus collects and stores system timers without rounding (at least 6 decimal points). So, we will be looking into increasing metrics resolution by giving users option to display more than 3 decimals in the next version.
Accuracy: I reviewed the 5 numbers that you compared, and they make perfect sense to me.
An example set of average response times:
KeyIndicator Table: 0.0034 - This is what StresStimulus calculated when averaged all data points including
zeros. StresStimulus will display a rounded to 3 decimal points number as 0.003
Agent: 0.0017 - The average response time for agents is calculated without using graph
data points. They are calculated using every request, regardless to which data point they belongs to.
My Average of all points found in exported csv file (including zeros): 0.0025 - Apparently you need more than 3 digit accuracy. However, exporting to the csv file rounds the data to 3 digits and reduces accuracy. You should average the unrounded values from the table storing the data points as StresStimulus does. In this case you will get something close to 0.0034 which is the number from the KeyIndicator Table.
my average from non-zero points: 0.0072 - This result is not unexpected since you excluded the data points with fast response.
my average from all points where req/sec was non-zero: .0068 - This result is not unexpected as well since you arbitrary excluded some data points (see below why you should not do that).
Excluding sessions with zero-request/second I believe that you suggest that the data points displaying zero-request/second should be excluded from the calculation of the average response time because during these intervals no request were sent, Failing to do so will artificially lowering the average response time.
This is actually incorrect and here's why. While there could be checkpoints designating intervals during which no new requests were sent, during the same intervals some previously issued requests will be received. Therefore zero request/second does not automatically mean zero response time. Excluding such responses from the calculation gave that meaningless result.
Overall the graphs are based on the data collected at certain checkpoints. They help to monitoring a load test while it is running. On the other hand, request details data in the test results section and performance metrics in the report are based on processing every session at the time when the requests are actually sent and received.
Does this make sense?
-Vadim
|
|
|
0
link
|
|
Brianna Blanchard Posts: 76
6/7/2013
|
Ah, OK, so the difference between the CSV and the agent is because of rounding upon export. That makes sense. I think that in general, the 3 decimal points/1ms resolution would be fine, but the summary table only has a 2 decimal point resolution. I guess my question at this point is if there is only one agent being used, is the agent results table a valid summary for test? And if it is not, is there a table that's created in SQL that I could process myself to get at least 1ms resolution?
also, for the zero request/second: I see what you are saying, and I agree that it doesn't automatically imply zero response time, but because of the length of time for which there are no requests is several seconds and the maximum response time is about 17 ms, I'm fairly certain there are ineed times when no response is being received. If there was somewhere in the SQL results I could get the list of response times to a greater accuracy to look at once or twice, I would feel better about trusting the summary numbers that are shown. As a note, if the values are off by a few ms, that's less important to me than seeing the difference between 2 and 20 ms; I just want to know if is the case that 3 ms might really mean 5 ms.
|
|
|
0
link
|
|
Vadim @StresStimulus Administrator Posts: 583
6/7/2013
|
Brianna
Here are some more clarification on your points/ questions
"...the difference between the CSV and the agent is because of rounding upon export."
This is incorrect. Let me explain it with more details. StresStimulus operates 2 independent datasets collected at different points:
- Graph data are gathered with a constant period equal to the sample rate (5 seconds by default). These data are used for graphs only. They are not used to calculate any other numbers on the reports.
- Session timers are gathered at the moments of actual sending requests and receiving responses. These numbers are used to calculate all performance metrics on the reports.
So, the data points exported to the CSV file belong to the 1st data set. The Agent data is based in the 2nd data set. The 2nd dataset is more accurate than the 1st one.
"...in general, the 3 decimal points/1ms resolution would be fine, but the summary table only has a 2 decimal point resolution".
As I said, we will change it to show more digits in the next version. See below for more options available in the current version.
"...my question at this point is if there is only one agent being used, is the agent results table a valid summary for test?"
Yes.
"...If there was somewhere in the SQL results I could get the list of response times to a greater accuracy to look at once or twice, I would feel better about trusting the summary numbers that are shown. As a note, if the values are off by a few ms, that's less important to me than seeing the difference between 2 and 20 ms; I just want to know if is the case that 3 ms might really mean 5 ms."
Yes. Items 3 and 4 in this post describe how, in the Enterprise Edition, you can access all sessions' response times with microsecond accuracy. StresStimulus numbers can be independently verified by conducting calculations using Fiddler timers for every session stored in the SQL database. Because of that, users can have confidence in StresStimulus numbers. So, if you see two numbers, 2 and 20 ms, it means that they represent different metrics.
|
|
|
0
link
|
|
Brianna Blanchard Posts: 76
6/8/2013
|
Session timers are gathered at the moments of actual sending requests and receiving responses. These numbers are used to calculate all performance metrics on the reports.
That is good to know. It seems that the Agent results will provide what I need for now, then. Thank you.
I do not, however, have Enterprise Edition, which appears to mean I don't get any of the timers you mentioned. Is there another way to access some of the raw data?
|
|
|
0
link
|
|
Vadim @StresStimulus Administrator Posts: 583
6/8/2013
|
You're welcome, Brianna.
In order to query the un-rounded timers data, the Enterprise Edition is required.
|
|
|
0
link
|