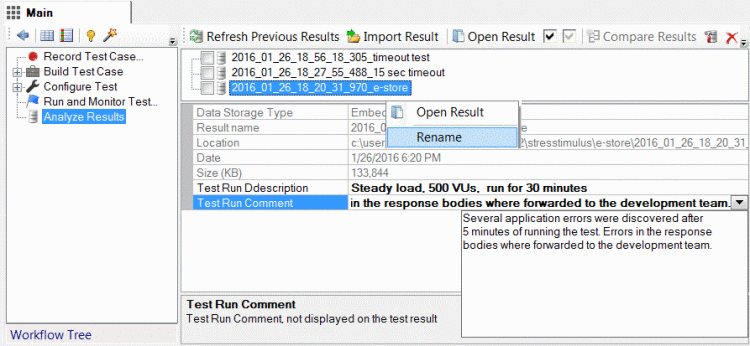
1. Easier test annotation. Now you can quickly add comments to multiple tests after their execution. In the analyze results tree, select a test and enter comments in the Test Run Comment property. The comments are not included in the test results. You can also edit the Test Run Description property which is included in the test summary. 

2. Sorting test results. Now you can sort test results by name or by date (ascending /descending). 
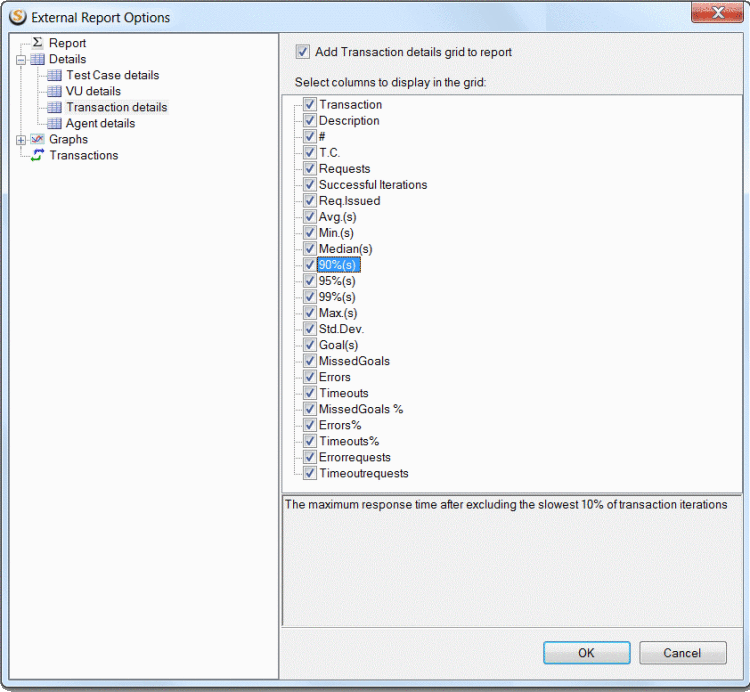
3.  External Report customization. In the previous versions, external reports included all data generated by the test. In the current version, you can select which pages, transactions and which views and graphs you wish to include in your report. Also, you can select which grid columns you want to include in the details report.

4.  External report friendly file names. When you save an external report, its default names match the test run name in the Analyze Report section.
5.  Highlighting page and transaction errors and timeouts. On page and transaction waterfall charts, errors and timeouts are now color-coded. Also, when you mouse over a request which timed out, its tooltip will mark such requests as timed out.
6.  More data on waterfall charts. On the vertical axle, along with every request name, a session number is displayed as well. This simplifies crosschecking sessions on the graph and in the test case.
7.  Report customization. When you select the order in the test result detailed view, the system will remember it for next time. Report configuration persistence helps to preserve users' favorite settings.
8. Passed/Failed iterations. In the previous versions, the concept of failed iteration was not supported. In this version, you can configure a validator to mark its containing pages/transactions as failed based on custom conditions. Performance metrics of such pages/transactions are excluded from the test metrics 
9. Closer iteration monitoring. On the Test Progress window in the runtime dashboard, display real-time count of started, passed, failed, and incomplete iterations. 
10. Iteration details. Now the count of Passed / Failed iterations is reported on the test summary report. Passed / failed iterations by VU, Test Case and Agent are reported in the detailed view (see  and
and  ).
).
11.  Quick error analysis. In the Error View select a row, right-click and select Compare with Recorded. The system will determine which user in which iteration encountered this error and then will display a tree which compares all replayed sessions for this user's iteration with the recorded sessions. This can help to discover preceding and subsequent errors and find out the root cause of the error faster. Another troubleshooting option is in the error view is right-click on the error and select See Waterfall for this VU iteration
  From there you can select Compare with Recorded.
12. Ability to analyze individual sessions in the context of the test. For any replayed sessions, now you can display VU and iteration number, as well as time interval from the start of the test when it was issued. This information helps to correlate the session with other sessions in an iteration. For example, you can determine how a session's response impacted subsequent sessions and outcome of the test iteration. 
13. Compare transaction and page response Times across multiple tests. On the test comparison report, added sections displays side-by-side response time for all transaction and pages across all compared tests. 
14. Better test readability: truncated responses. If a session response was purged by StresStimulus, the session inspector will display the message "StresStimulus truncated" in place of the response content. This simplifies reading the test log. 
15. Better test readability: timeouts. Because responses for the timed out sessions are not received in time, they cannot be stored in the test log. Session inspector will display the message "StresStimulus timeout" in place of the response payload for a session with a timeout. 
16. More visible tabs. In the previous versions, when you open multiple tabs with reports and sub reports, you would need to click the horizontal Scroll buttons multiple times to see the tabs on the edges. In the current version, the system will try to display more tabs in the visible area by condensing them.
17. Response time of a transaction, page and test case now excludes all think times.
18. On the Page and Transaction curve grid added a column Iterations which displays the number of times this Transaction or Page was completed successfully.
To navigate to other parts of the v4.3 release notes, click the links below:
4.3 is available here