Test Pass/Fail Qualification
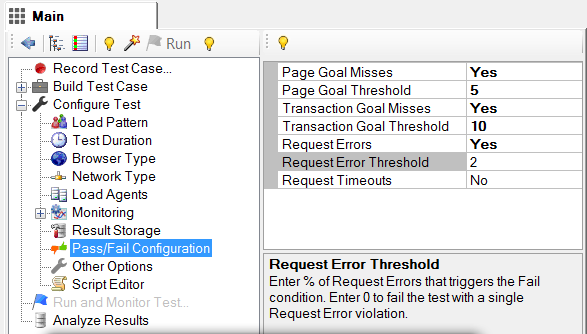
1. Test Pass/Fail Qualification. You can define custom test quality criteria which will define the Pass/Fail outcome of the test. The list of available criteria includes percentage of page goal misses, transaction goal misses, request errors and request timeouts http://support.stresstimulus.com/display/doc42/Configuring+Test+Pass-Fail+Qualification
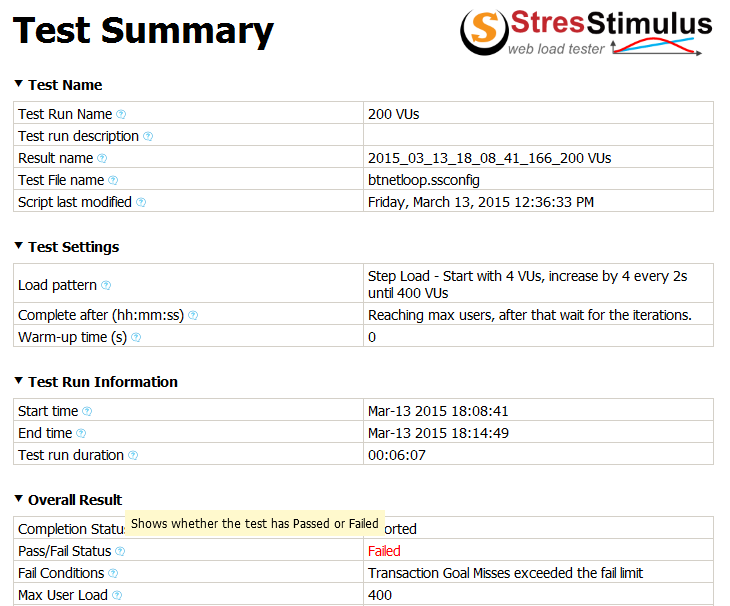
2. Pass/Fail Status in the test results. Test Pass/Fail Status is displayed in the test result's Summary view. If test failed any of its quality criteria, a list of failing conditions will be displayed as well. http://support.stresstimulus.com/display/doc40/Summary+View
3. Test outcome in automation tasks. Pass/Fail exit code is added to the command line interface. The process will return exit code 1 if the test failed the test quality criteria. Now, StresStimulus can be used as a part of a build process using various technologies, such as PowerShell. http://support.stresstimulus.com/display/doc42/Command+line+interface+for+Standalone+version
Performance counters
4. Simplified configuration of server monitoring. In the previous versions, every performance counter was added separately. In this version when you add a server for monitoring, the basic set of performance counters is added as well. It includes server CPU, memory, disk and network. http://support.stresstimulus.com/display/doc42/Adding+Monitors
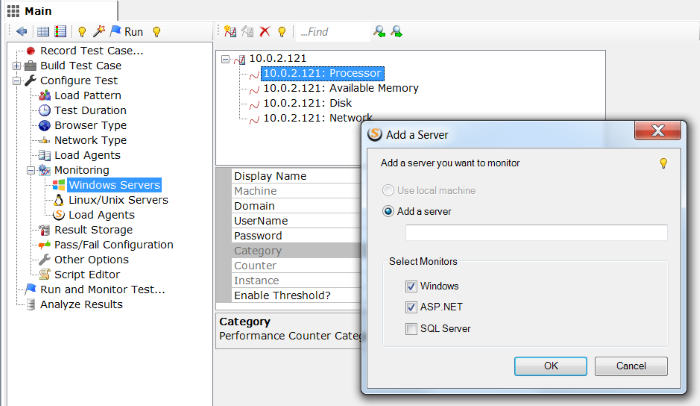
5. Preset performance monitors. Depending on functions performed by the server you wish to monitor, you can add one or several performance monitors each of which includes preselected set of performance counters: the following monitors are currently supported: Windows, ASP.net, SQL Server. http://support.stresstimulus.com/display/doc42/Adding+Monitors
Real Time and Result Graphs
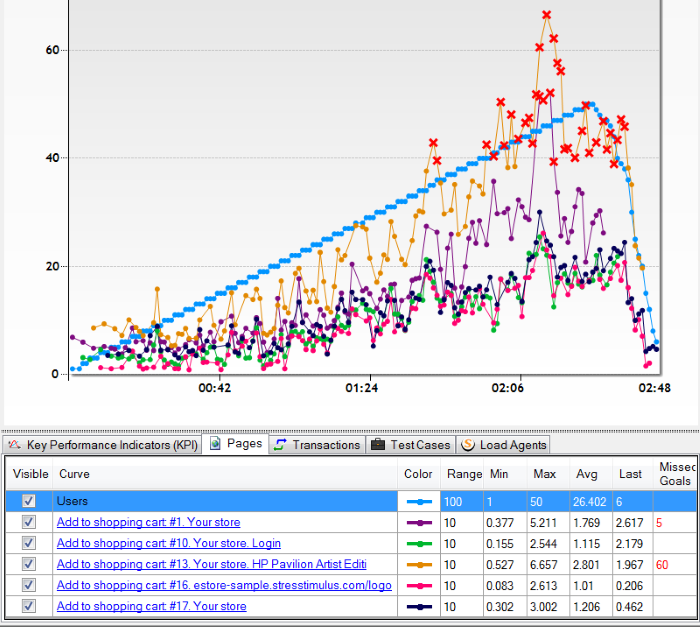
6. Individual tabs for curve grids. In the previous versions, multiple curve grids were located in one scrollable grid group. In this version, every grid has its own tab. This improvement simplified navigation between grids, as scrolling is no longer necessary. This also removed a limitation that all groups must have the same set of columns. Now every grid has its own set of columns to better reflect its content. http://support.stresstimulus.com/display/doc42/Layout

7. In the runtime dashboard, the Test case and the Agent grid are moved to separate tabs below graphs for added convenience and uniformity. They no longer need to be enabled from the toolbar. No more scrolling is required to display them. http://support.stresstimulus.com/display/doc42/Agents+Test+Cases+Grid
8. Added sorting to the curve grids. Now you can click on the page response time column to quickly identify the slowest page and then click on its name column to open page sub-report for further analysis. http://support.stresstimulus.com/display/doc42/Monitoring+Performance
9. Monitor missed goals for pages and transactions. Before, missed goals only appeared on the detail grid in test results. Now you can track missed goals in real time. They are handled as threshold violation and are displayed in real-time graphs. You can configure which track missed goal for pages and transaction http://support.stresstimulus.com/display/doc42/Graphing+Threshold+Violations
10. Better interoperability between graphs and grids. When click on a graph, the corresponding grid is selected.http://support.stresstimulus.com/display/doc42/Graph+Commands
11. Context-sensitive commands on curve grid. You can right-click on the curve grid row to execute several curve commands on the graph, such as highlight the curve, hide all but this curve and unhide all.
http://support.stresstimulus.com/display/doc42/Grid+Commands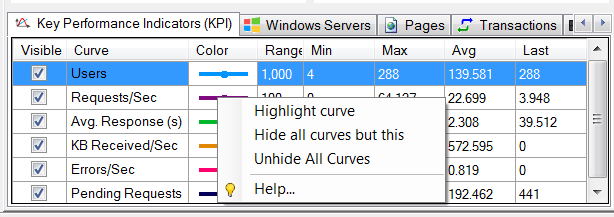
To navigate to other parts of the v4.2 release notes, click the links below:
4.2 is available here