|
Brianna Blanchard Posts: 76
7/19/2013
|
I've begun running tests that involve pages (rather than just simple requests), and I don't think I understand the Page response times under Page Details. I have designated a primary request and there are 16 dependent requests. When I look at the page under page details, what are are those response time metrics (average, minimum, median, etc) measuring? The time elapsed from the issuing of the primary request to the response of the last dependent request? The time to first byte of the primary request?
I'm particularly confused because of how the numbers I see for the average (90 ms) for the page compare to the request details: the primary request has an average response time of 6ms, and each dependent request has an average response time of about 250ms. From the request details, I would expect an average page response time of about 256ms: the primary request takes 6 ms, then all the dependent requests are fired off in parallel and return about 250 ms later, for a total time of 256 ms.
I want to know two things from my test: how long this set of requests for the page takes as a whole, and how long they take individually. Can I get these numbers out of StresStimulus?
|
|
|
0
link
|
|
Max @StresStimulus Administrator Posts: 101
7/19/2013
|
- A page time is time elapsed from the issuing of the primary request to the response of the last Performance Impacting dependent Requests.
- Performance impacting requests include page resources such as css, javascript and images.
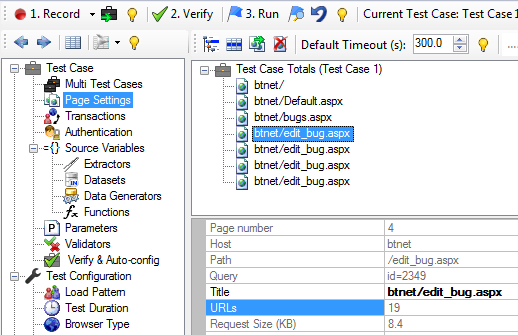
- To determine the number of such requests, go to Page Settings node, select a page and look at the URLs property.
- Performance impacting requests exclude dependent requests presumed to be loaded after the page is displays, e.g. AJAX, as determined by StresStimulus.
To better understand page performance metrics you can examine its waterfall diagram.
To display a page waterfall diagram, select all page requests in fiddler and then select the Timeline tab in Fiddler.
If you want me to take a look at your specific page metrics, please upload your test case to our secure support repository and make sure to select test results.
|
|
|
0
link
|
|
Brianna Blanchard Posts: 76
7/19/2013
|
A page time is time elapsed from the issuing of the primary request to the response of the last Performance Impacting dependent Requests.
Excellent, this is what I thought it did. However, I'm still unsure whether or not my requests are counted as Performance Impacting. I did upload the test case to the support repository so you could look at it directly, but I would like to understand a little better how to determine what requests count as performance impacting.
Performance impacting requests include page resources such as css, javascript and images.
The requests I am concerned with are images, but the request are like http://mypage/directory/thepage.aspx?myparam=stuff;anotherparam=morestuff, i.e. the requests aren't in the format of myimageresource.png. Is SS able to tell that the response is an image even if the request doesn't end in an image file extention?
I took a look at the number of URLS under the page settings section, and it matched the number of requests; what does that mean?
I tried looking at the page waterfall diagram, and the primary request was significantly faster than the subsequent requests, so the scale made the diagram hard to read, and again, I'm not sure what I'm looking for.
Finally, if my requests are not being counted as "Performance Impacting", is there any way to explicitly designate them as such?
|
|
|
0
link
|
|
Max @StresStimulus Administrator Posts: 101
7/22/2013
|
One correction: in the Page Settings node the URLs property of the Page displays the total number of requests, not the number of performance impacting requests. We are adding this property in v3.0.
Excellent, this is what I thought it did. However, I'm still unsure whether or not my requests are counted as Performance Impacting.
Currently, you can determine the number of page performance impacting requests by selecting "show sessions".
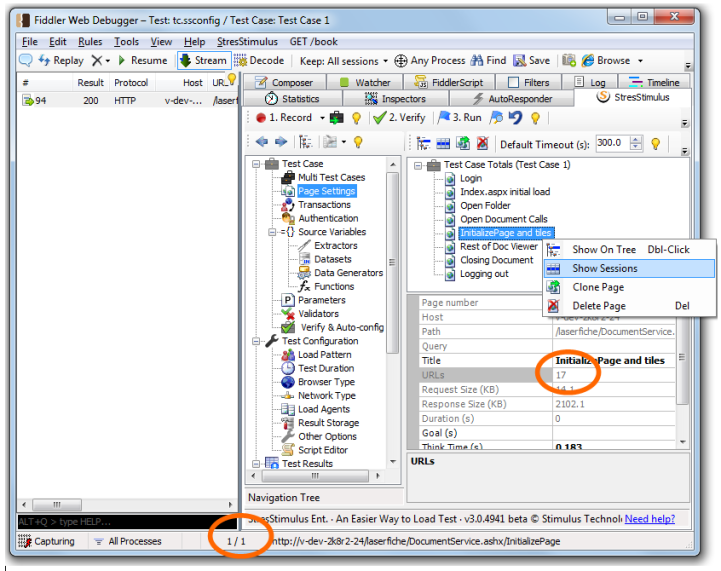
While your page in question has 17 requests, only the 1-st is counted by StresStimulus as performance impacting.
The requests I am concerned with are images
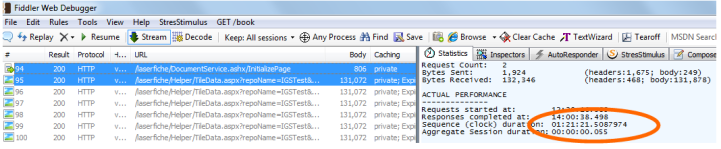
StresStimulus uses a heuristic algorithm to determine non-performance impacting requests. In this case, StresStimulus determined that sessions 2-17 on this page are ajax requests because request 2 was issued about 1 hour after the response 1 was received. To determine this, I selected first two requests of this page in fiddler and statistics shows that sequence (clock) duration is 1 hour and 20 minutes. It looks like you added requests 2-17 to this test case after it was recorded and therefore their timers are off from the timers of other test case requests.
Finally, if my requests are not being counted as "Performance Impacting", is there any way to explicitly designate them as such?
You can to create a transaction which includes all requests from this page. Transaction will not exclude Ajax requests.
|
|
|
0
link
|
|
Brianna Blanchard Posts: 76
7/22/2013
|
Thank you for the detailed response. I had made a mistake when originally creating the test, so had I replaced just those requests; I didn't realize this would impact how the test was run.
From looking at the time line + selecting the page and choosing to "show sessions", I think it's fixed now I selected all the requests in the page (including the primary) and chose to "Reissue Unconditionally", added the replayed requests to the test case, and replaced the old page. Is there a reason this approach might cause problems?
I chose not to use a "Transaction" because none of my requests is specificially the "end" of the page; there is an initialize request, then the rest should all be requests concurrently as fast as possible until they are all returned. Though, perhaps I misunderstood how transactions work?
|
|
|
0
link
|
|
Max @StresStimulus Administrator Posts: 101
7/22/2013
|
Is there a reason this approach might cause problems?
Think time for this page will be off, but if you do not use think times, it should be fine.
Though, perhaps I misunderstood how transactions work?
Transactions will not change how requests are sent. They will just group these requests for calculation purposes.
|
|
|
0
link
|
|
Brianna Blanchard Posts: 76
7/22/2013
|
Think time for this page will be off, but if you do not use think times, it should be fine.
Do you mean just the automatically "Recorded" think times, or that if I manually add a think time it will be ignored? It appears that my manually added think time is being respected, but I just wanted to double-check.
Transactions will not change how requests are sent. They will just group these requests for calculation purposes.
Oh, it might work then. I was worried that if I set the Last Request and one of the requests other than the Last Requests takes the longest to return, this later request would not be included in the calculation because it returned after the Last Request.
|
|
|
0
link
|
|
Max @StresStimulus Administrator Posts: 101
7/23/2013
|
Yes manual think times will work, and will override the automatic think times.
|
|
|
0
link
|
|
Brianna Blanchard Posts: 76
7/23/2013
|
I ran one of my updated tests, and I also designated the same set of requests (including the primary request) as a transaction. The statistics for the page vs. the transaction for the same set of requests are very different (for one run, the average for the transaction was 468 ms, but the page it had an average of 259 ms). Does this mean my "page" isn't actually fixed? Or is there another reason these metrics are so different? All the sessions I expect to show up when I select "Show sessions" for that page do.
Furthermore, the number of iterations listed for that page is 190, despite the fact (a) I have 10 users set to run 10 iterations each and (b) most of the other pages have the expected number of iterations, with the exception of a page that has 109 iterations. Why would this page be request more than than expected?
I'm not sure if it makes sense to continue these questions under this thread, so let me know if I should post them elsewhere.
|
|
|
0
link
|
|
Max @StresStimulus Administrator Posts: 101
7/23/2013
|
This happens because page times is calculated using a slightly more accurate method. StresStimulus removes delays caused by the client machine's thread context switching. If the client machine is not overloaded, such delays are minimal. This adjustment is not implemented for transactions yet, but it will be added in the next 3.0 maintenance release.
|
|
|
0
link
|
|
Brianna Blanchard Posts: 76
7/23/2013
|
Ah, OK. Thank you; I will continue to use the page times for now.
However, there's still the matter of the strange number of iterations. Why would that page be requested 190 times instead of 100?
|
|
|
0
link
|
|
Max @StresStimulus Administrator Posts: 101
7/24/2013
|
I was unable to replicate it so far, but we just issued a new maintenance release v3.0.4953, which has more accurate transactions times. You should not see discrepancies between pages and transactions now.
|
|
|
0
link
|
|
Brianna Blanchard Posts: 76
7/25/2013
|
I updated to the latest version, and the transactions and pages times do match  Also, I am no longer able to reproduce the unexpected number of iterations, where before I was seeing it every time I ran the test. Also, I am no longer able to reproduce the unexpected number of iterations, where before I was seeing it every time I ran the test.
Thanks for all your help!
|
|
|
0
link
|
|
Max @StresStimulus Administrator Posts: 101
7/25/2013
|
You're welcome. Thank you for posting your update about resolved issues.
|
|
|
0
link
|
|
Rahul Tyagi Posts: 1
4/17/2014
|
Can you please let me know the resolution to this query. I believe I have the same conflict as well.
|
|
|
0
link
|
|
Max @StresStimulus Administrator Posts: 101
4/17/2014
|
Rahul.
The issue in this discussion was resolved in v3.0 in Jul-2013, so make sure you use the latest version 3.5 or 3.7.
Also, please provide some details of the situation you need to resolve, in a separate discussion, and we'll be happy to assist you.
|
|
|
0
link
|