Need help with StresStimulus? Start here.
Interpreting the final results and presenting data
|
Sundara J Posts: 11
2/12/2013
|
Hi Guys,
Am trying to present data in a way as below , do you know what would be the easiest way to do this would be ? generating the reports doesnt collate the data based on VU # to time per page. I get the overall after a 50 VU but would like a breakdown on page response time / number of users ?
| | | | | Scenario 1 : On a individual page | | Virtual User(s) | Avg. (s) | Min. (s) | Median (s) | | 1 | 6.82 | 6.82 | 6.82 | | 2 | 7.264 | 7.058 | 7.292 | | 5 | 8.538 | 6.145 | 8.092 | | 10 | 10.992 | 7.133 | 10.837 | | 20 | 17.15 | 6.967 | 15.981 | | 35 | 26.019 | 7.48 | 24.832 | | 50 | 36.502 | 6.644 | 36.201 |
|
|
|
0
link
|
|
Vadim @StresStimulus Administrator Posts: 583
2/12/2013
|
Sundara,
One approach would be to run 7 tests with 1, 2, 5, 10, 20, 35 and 50 VUs respectively. Reflect the number of VUs in the each test run name. After that in the Previous Results section, select these tests
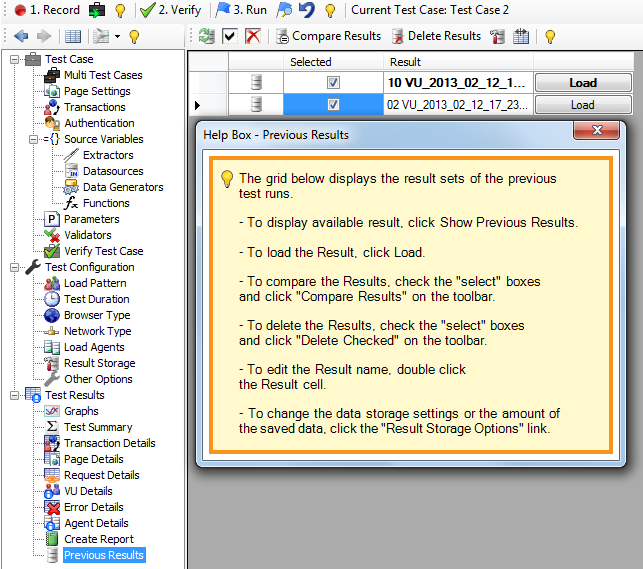
and create “Test Summary Comparison” report.
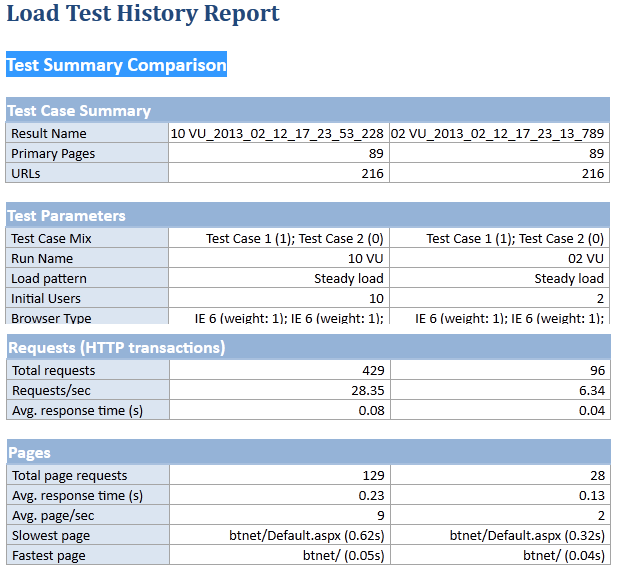 Then import the HTML report into Excel, delete unnecessary rows and transpose it to display user data in the rows. Then import the HTML report into Excel, delete unnecessary rows and transpose it to display user data in the rows.
Also, if you have the Enterprise Edition, you can build your own report by querying SQL Server tables directly. the table structure is shown in the item 3 of this post http://www.stresstimulus.com/blog/post/what-s-new-in-v2-5-part-4-enterprise-features
|
|
|
0
link
|
Copyright © 2026 Stimulus Technology