StresStimulus releases and other announcements.
New update: Graphs and more
|
Vadim @StresStimulus Administrator Posts: 583
2/11/2011
|
Released today StresStimulus update (v. 0.8.4058) has added a graphs section and an option to add fewer load test sessions to Fiddler for better performance and faster testing.
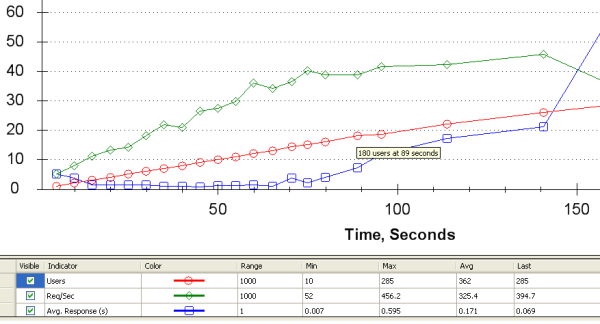
Graphs:The initial set of graphs includes Number of virtual users, Requests / sec and Average response time. Graphs help to quickly analyze test metrics. In the example below, a website starts slow down (increasing Avg response time - blue line) after reaching 180 users (red line). More graphs will be added in the future releases.
Adding sessions to Fiddler: Now you can opt to add sessions to Fiddler from all users, first user, or opt out from adding sessions. Select “First User” to save testing time, and still be able to see a user waterfall diagram (in Timeline tab) covering the entire duration of the test. Select “No” to save even more time if you need only aggregated metrics of the load test.
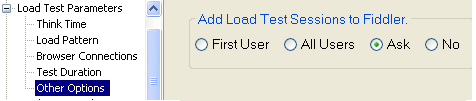
If select “Ask”, then you will be offered to make you selection after the load test completion.

Several bugs are fixed including a problem with installation on 64-bit OS.
Click on "Check for Updates" in StresStimulus, or to download the latest version click here.
|
|
|
0
link
|
Copyright © 2026 Stimulus Technology