Need help with StresStimulus? Start here.
Need help to understand graphs
|
Unregistered User Posts: 514
3/31/2018
|
I not able to find any proper guide line video in which I should get learning from scratch. if there is any tutorial please let me know. My company is interested in buying stress testing tool I have to give them a demo.
I am not able to understand the graphical representation of the results, is there any document that describes each color and its role ?
|
|
|
0
link
|
|
George @StresStimulus Administrator Posts: 570
3/31/2018
|
Regarding training videos: we have two series of training videos located here http://www.stresstimulus.com/videos/catalog
Getting Started Videos series includes five step-by-step videos were you can learn all steps from installing StresStimulus, recording and configure a test scenario, running the test, to monitoring performance and analyzing results
How-To Videos series cover specific topics, like testing multiple logins, testing secure websites, etc.
Additionally here is the Getting Started guide which teaches how to create your 1st test from beginning to the end http://support.stresstimulus.com/display/doc48/Getting+Started
On your 2nd question : Graphical representation of the results UI is similar to the graphical representation UI during the test run. It is described in this guide http://support.stresstimulus.com/display/doc48/Monitoring+Performance
It also shown in the video “Running The Test “ http://www.stresstimulus.com/videos/running-test
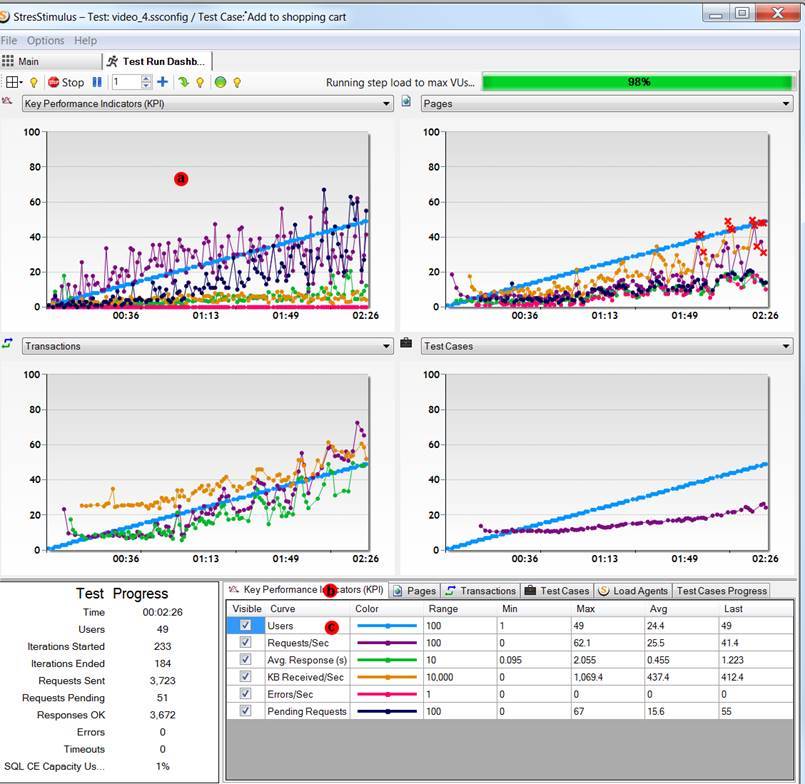
Basically every graph (a), has a matching tab (b) that shows curve grid explaining every curve color in the column (c) - see below
To simplify analyzing graphical results, you can hide any curve by clicking checkbox Visible in the curve grid http://support.stresstimulus.com/display/doc48/Graph+Commands
Additionally, there is Analyzing Results guide that describes how to interpret performance metrics http://support.stresstimulus.com/display/doc48/Analyzing+Results
|
|
|
0
link
|
Copyright © 2026 Stimulus Technology