Need help with StresStimulus? Start here.
How to interpret graphs
|
Unregistered User Posts: 514
11/6/2017
|
I am unclear how to read the graphical results. Our product is a single page application. Therefore, the slowest pages don’t carry the same meaning like in the server aspx architecture. Here is one of the examples.
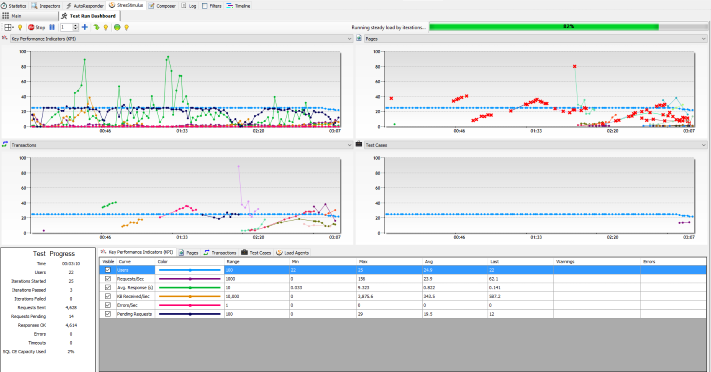
The average statistics / text are clearke to gain a solid understanding of the charts to be able to explain in meetings and more importantly improve the response times / weak areas of our product.
|
|
|
0
link
|
Copyright © 2026 Stimulus Technology