Need help with StresStimulus? Start here.
How to collate KPI data to 5 minute intervals
|
Unregistered User Posts: 514
7/1/2023
|
Our project had a requirement to share the Requests/second, Average response time, Errors/sec, Total Transactions / Second and Users for every 5 minute interval.
We are trying to collate this information by exporting the KPI graphs to csv.
What calculations should we use to receive the KPI data for every 5 minute intervals.
|
|
|
0
link
|
|
George @StresStimulus Administrator Posts: 570
7/1/2023
|
The KPI graph data is calculated based on the graph sample rate setting as described https://support.stresstimulus.com/display/doc58/Graphing+Performance+Metrics
By default, it is set to 5 seconds.
It looks like you would like to take the KPI data collected every 5 seconds and aggregate them manually to determine the KPI data at every 5 minutes.
To your question, I am unsure which manual collating algorithm is more accurate.
I recommend changing the graph sample rate to 300 seconds.
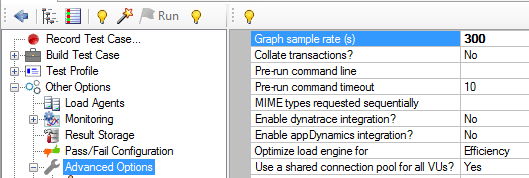
This way, the tool would automatically provide you with the numbers you want, so you do not need to do any manual calculations.
|
|
|
0
link
|
Copyright © 2026 Stimulus Technology