Released today, the v4.0 update completely redesigned the test result analysis block. It includes multiple new features and enhancements. Here is the list of the 10 main benefits:
1. New results presentation dimension. V4.0 now supports multi-document interface that allows opening multiple functional areas by using horizontal tabs. The workflow tree with all steps of configuring test cases is now located under the Main tab (a). Runtime Dashboard tab opens during the test run (b). One or several test results can be open in Test Results tabs (c). The new presentation dimension simplifies user navigation and allows accessing more information in less time.
2. Opening multiple results at once. The Analyze Results section is redesigned to allow opening multiple test results (c) side-by-side see (http://support.stresstimulus.com/display/doc40/Opening+Previous+Results)
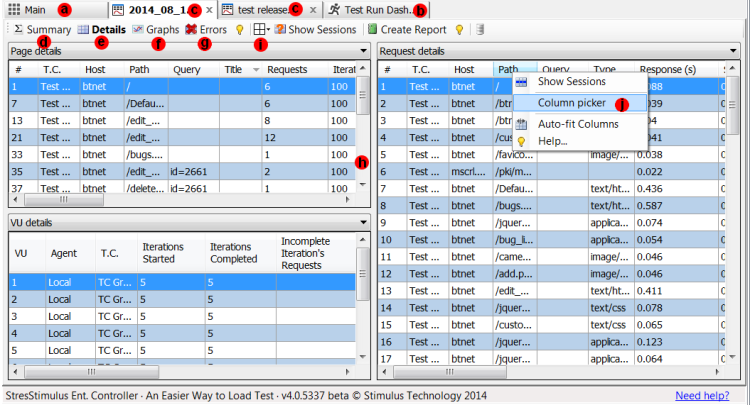
3. Test Result tab has four easy to switch views: Summary View (d), Detail View (e), Graph View (f) and Error View (g) can be selected on the toolbar.
4. Enhanced Summary view includes several subsections that can be expanded / collapsed (see http://support.stresstimulus.com/display/doc40/Summary+View )
5. More goal-oriented test analysis. The summary view now includes information about the number of pages and transactions missed the goals.
6. Enhanced Detail View allows to display up four (h) grids on the screen and to select the desired layout (i) (see http://support.stresstimulus.com/display/doc40/Layout+functionality )
7. Easier to analyze Error View. Failed request instances are now grouped by a Test Case and request number (see http://support.stresstimulus.com/display/doc40/Error+View )
8. Column Picker allows hiding / un-hiding columns in every grid.
9. Substantially expanded graph view, that includes now response time curve for every page, transaction and test case (see http://support.stresstimulus.com/display/doc40/Graph+Commands)
10. More customizable report. Customization changes made in the Detail View, such as sorting and hiding / un-hiding columns will be reflected in the Load Test report. Also, graph customization as to what curves to show or hide will be reflected in the report as well.
To navigate to other parts of the v4.0 release notes, click the links below:
4.0 is available here.