Get Insight Into Your Web Application Responsiveness
Interactive performance reports of your website allow to quickly isolate problem areas by navigating from the load test summary report to a hyperlinked transaction or web page sub report, and even further to individual requests and HTTP headers and bodies. Every performance report features a set of graph, grid, and document views.
Interactive Subreport for Every Web Page and Transaction
In graph view, click or mouse over virtually any element to display more details and drill down or expose additional performance analytics functionality.
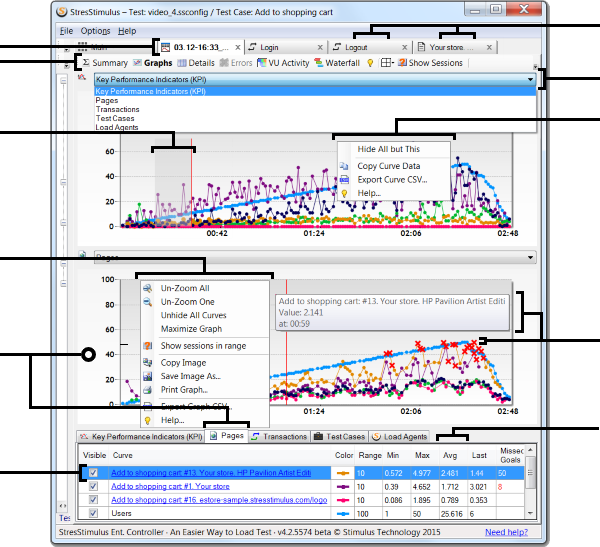
reports in separate tabs
between multiple graph, grid,
and document views
to customize its view
highlight its curve grid
to open a page sub-report
in a new tab
select a graph
to expose curve-specific
functionality
violation or a data point
to display its value
select the slowest page
Dual Waterfall: Performance Vulnerabilities Exposed
Now for the first time in load testing, you can compare side-by-side waterfalls of a page, transaction or the entire test case, executed by two different virtual users during any selected test iterations, and immediately visualize which requests' responsiveness is impacted by the stress levels most. This new instrumentation allows to analyze web application responsiveness on a very granular level. Pick and choose any VUs and Iterations from the test activity diagram to analyze unusual patterns.
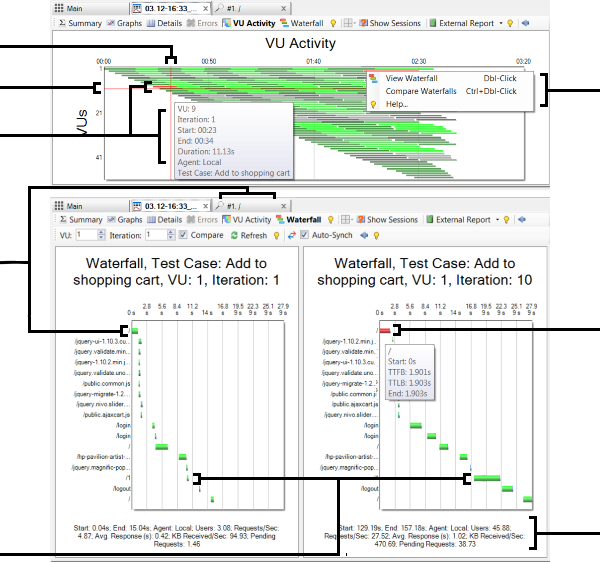
to increased load resources
impacting page responsiveness
Get Concrete Answers to Hard Performance Questions: How Many Users Can Your Site Handle?
Get concrete answers to the critical performance questions in the interactive test reports. In this test, when the number of virtual users reaches 44, the slowest web page will consistently miss its speed target.
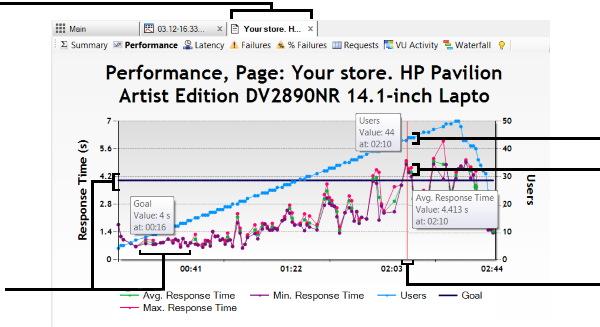
open the slowest page subreport
time curve and its goal line
What's Next
Download StresStimulus
Download StresStimulus registration-free, install it on as many machines as you need and start your proof-of-concept testing with three VUs.
DownloadRegister for a Trial
Start your 7-day extendable trial with up to 10k VUs and full support for end-to-end evaluation. We will even configure your first test free.
Get TrialRequest Product Demo
Request a demo and one of our load testing consultants will give you a guided tour of how you can use StresStimulus to test your application.
Request Product DemoEnterprise Eval. Program
For the most in-depth evaluation, check our Enterprise Evaluation Program. Get up to a 5 week trial for your entire team with free training and Premium Support.
Get Enterprise Evaluation